29
/
en
AIzaSyAYiBZKx7MnpbEhh9jyipgxe19OcubqV5w
April 1, 2024
78254
Bangladesh
BGD
true
2
1
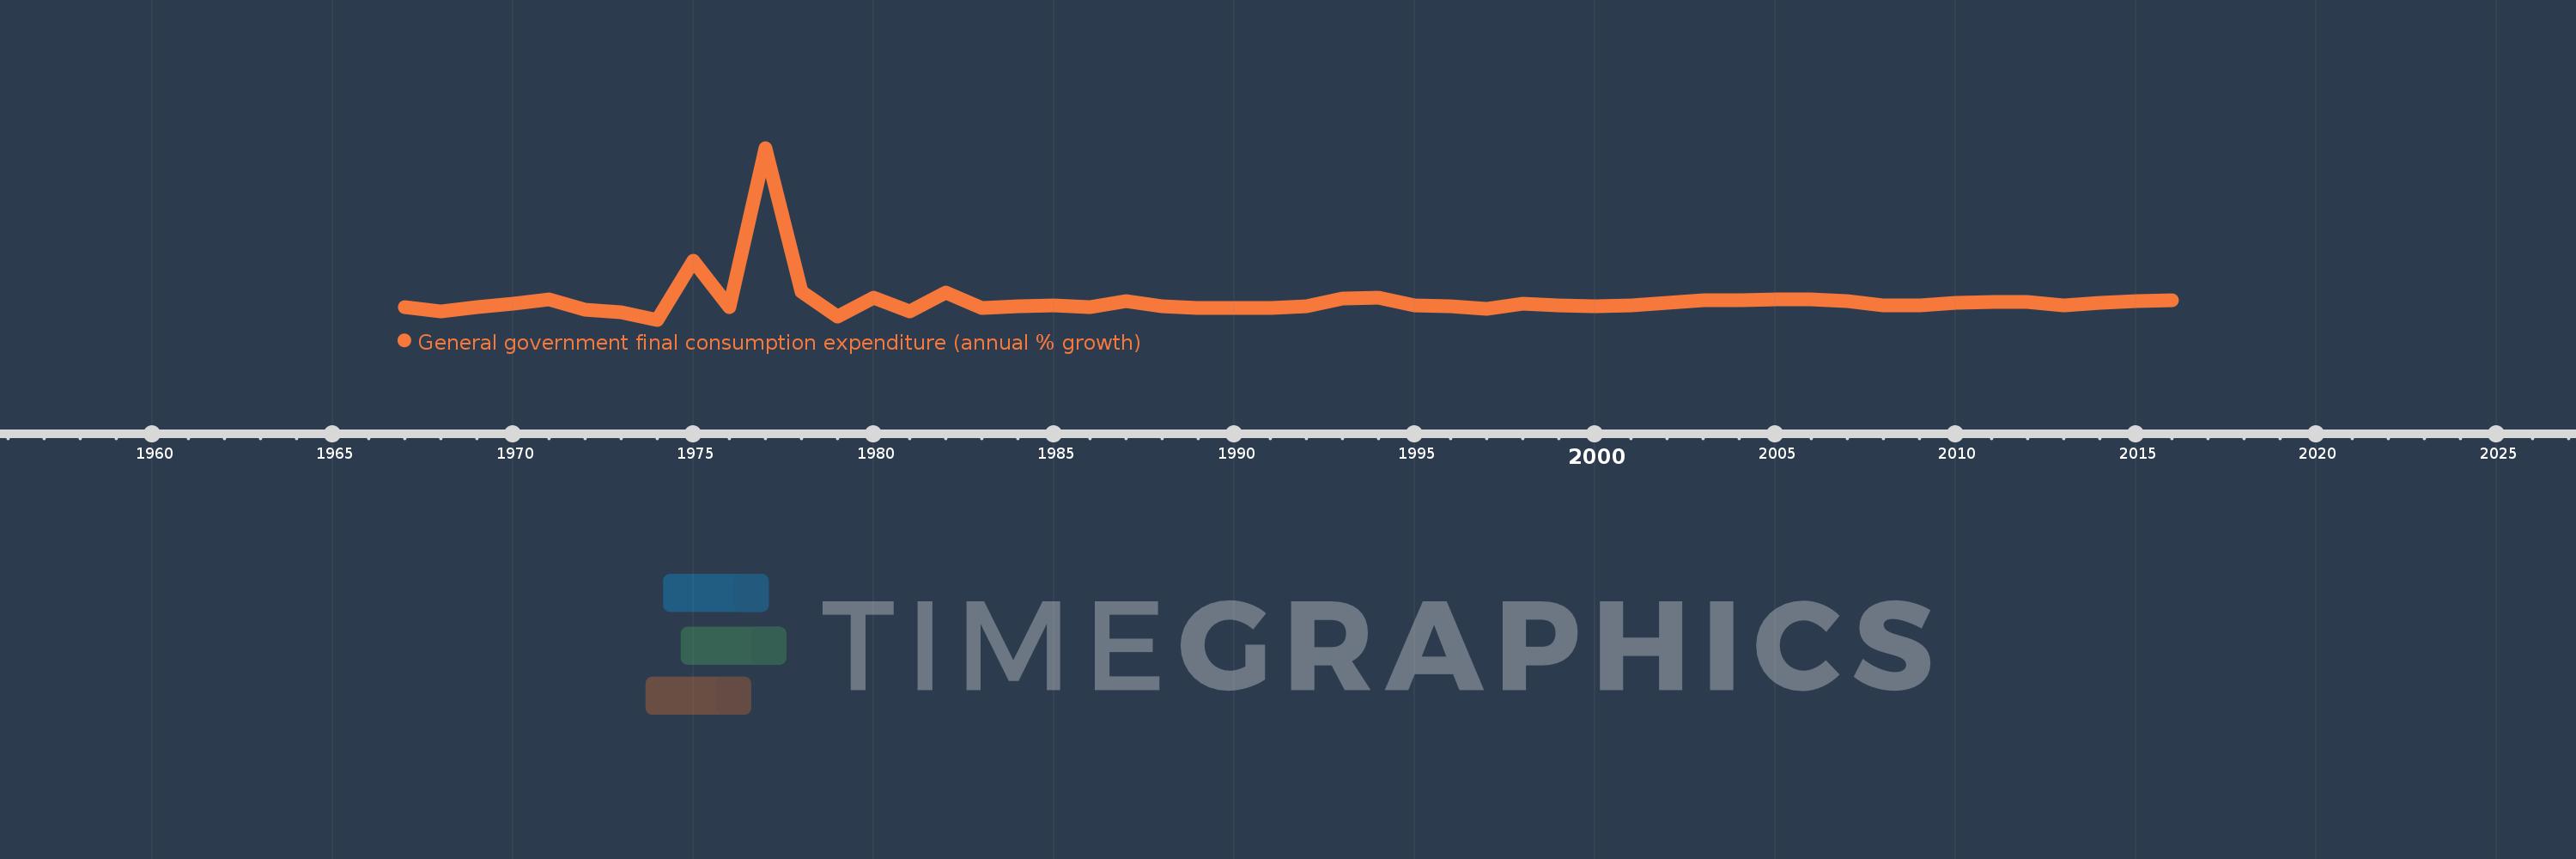
General government final consumption expenditure (annual % growth)
2016,2015,2014,2013,2012,2011,2010,2009,2008,2007,2006,2005,2004,2003,2002,2001,2000,1999,1998,1997,1996,1995,1994,1993,1992,1991,1990,1989,1988,1987,1986,1985,1984,1983,1982,1981,1980,1979,1978,1977,1976,1975,1974,1973,1972,1971,1970,1969,1968,1967
This statistics in other country:
AlbaniaAlgeriaAntigua and BarbudaArab WorldArgentinaArmeniaAustraliaAustriaAzerbaijanBahamas, TheBahrainBangladeshBarbadosBelarusBelgiumBelizeBeninBhutanBoliviaBosnia and HerzegovinaBotswanaBrazilBrunei DarussalamBulgariaBurkina FasoBurundiCabo VerdeCambodiaCameroonCanadaCaribbean small statesCentral Europe and the BalticsChadChileChinaColombiaComorosCongo, Dem. Rep.Congo, Rep.Costa RicaCote d'IvoireCroatiaCubaCyprusCzech RepublicDenmarkDjiboutiDominican RepublicEarly-demographic dividendEast Asia & PacificEast Asia & Pacific (excluding high income)East Asia & Pacific (IDA & IBRD countries)EcuadorEgypt, Arab Rep.El SalvadorEquatorial GuineaEritreaEstoniaEthiopiaEuro areaEurope & Central AsiaEurope & Central Asia (excluding high income)Europe & Central Asia (IDA & IBRD countries)European UnionFijiFinlandFranceGabonGambia, TheGeorgiaGermanyGhanaGreeceGuatemalaGuineaGuinea-BissauHaitiHeavily indebted poor countries (HIPC)High incomeHondurasHong Kong SAR, ChinaHungaryIBRD onlyIcelandIDA & IBRD totalIDA blendIDA onlyIDA totalIndiaIndonesiaIran, Islamic Rep.IrelandIsraelItalyJamaicaJapanJordanKazakhstanKenyaKorea, Rep.KosovoKuwaitKyrgyz RepublicLao PDRLate-demographic dividendLatin America & Caribbean Latin America & Caribbean (excluding high income)Latin America & the Caribbean (IDA & IBRD countries)LatviaLebanonLiberiaLithuaniaLow & middle incomeLow incomeLower middle incomeLuxembourgMacao SAR, ChinaMacedonia, FYRMadagascarMalawiMalaysiaMaliMaltaMauritaniaMauritiusMexicoMiddle East & North AfricaMiddle East & North Africa (excluding high income)Middle East & North Africa (IDA & IBRD countries)Middle incomeMoldovaMongoliaMontenegroMoroccoMozambiqueNamibiaNepalNetherlandsNew ZealandNicaraguaNigerNigeriaNorth AmericaNorwayOECD membersOmanOther small statesPakistanPanamaPapua New GuineaParaguayPeruPhilippinesPolandPortugalPost-demographic dividendPuerto RicoQatarRomaniaRussian FederationRwandaSaudi ArabiaSenegalSerbiaSeychellesSierra LeoneSingaporeSlovak RepublicSloveniaSmall statesSomaliaSouth AfricaSouth AsiaSouth Asia (IDA & IBRD)South SudanSpainSri LankaSub-Saharan Africa Sub-Saharan Africa (excluding high income)Sub-Saharan Africa (IDA & IBRD countries)SudanSurinameSwazilandSwedenSwitzerlandSyrian Arab RepublicTajikistanTanzaniaThailandTimor-LesteTogoTrinidad and TobagoTunisiaTurkeyTurkmenistanUgandaUkraineUnited Arab EmiratesUnited KingdomUnited StatesUpper middle incomeUruguayVanuatuVenezuela, RBVietnamWest Bank and GazaWorldZimbabwe Timeline:
This timeline shows a graph from 1967 to 2016 of Bangladesh. No data until 1966. Number of actual observations by date: 50.
Source name:
World Development Indicators
Source organization:
World Bank national accounts data, and OECD National Accounts data files.
Categories, topics:
Economy & Growth
Last updated:
apr 23, 2017
Indicators value changes by year
Minimum:
-12.267
jan 1, 1974
Maximum:
174.125
jan 1, 1977
At the date of observation
Value
Absolute change
Change from previous value
jan 1, 1967
1.842
+1.842
0.0%
jan 1, 1968
-2.947
-4.789
-260.03%
jan 1, 1969
1.434
+4.381
-148.66%
jan 1, 1970
4.934
+3.5
244.05%
jan 1, 1971
9.93
+4.996
101.26%
jan 1, 1972
-1.509
-11.439
-115.2%
jan 1, 1973
-4.24
-2.731
180.97%
jan 1, 1974
-12.267
-8.026
189.28%
jan 1, 1975
52.218
+64.484
-525.69%
jan 1, 1976
1.558
-50.66
-97.02%
jan 1, 1977
174.125
+172.567
11.08K%
jan 1, 1978
18.354
-155.771
-89.46%
jan 1, 1979
-8.416
-26.77
-145.86%
jan 1, 1980
11.282
+19.698
-234.04%
jan 1, 1981
-2.859
-14.14
-125.34%
jan 1, 1982
17.347
+20.206
-706.86%
jan 1, 1983
0.31
-17.037
-98.21%
jan 1, 1984
2.483
+2.173
700.35%
jan 1, 1985
3.725
+1.241
49.99%
jan 1, 1986
1.647
-2.078
-55.78%
jan 1, 1987
7.923
+6.276
381.05%
jan 1, 1988
2.045
-5.878
-74.19%
jan 1, 1989
0.784
-1.261
-61.69%
jan 1, 1990
0.644
-0.14
-17.82%
jan 1, 1991
0.416
-0.227
-35.32%
jan 1, 1992
2.078
+1.662
398.96%
jan 1, 1993
10.9
+8.822
424.5%
jan 1, 1994
11.701
+0.801
7.35%
jan 1, 1995
3.331
-8.37
-71.53%
jan 1, 1996
2.301
-1.031
-30.94%
jan 1, 1997
-0.817
-3.118
-135.52%
jan 1, 1998
4.842
+5.66
-692.46%
jan 1, 1999
3.051
-1.792
-37.0%
jan 1, 2000
2.786
-0.264
-8.66%
jan 1, 2001
3.686
+0.899
32.28%
jan 1, 2002
5.699
+2.013
54.63%
jan 1, 2003
9.273
+3.574
62.7%
jan 1, 2004
8.544
-0.729
-7.86%
jan 1, 2005
9.76
+1.216
14.23%
jan 1, 2006
9.787
+0.027
0.27%
jan 1, 2007
8.147
-1.64
-16.76%
jan 1, 2008
3.058
-5.089
-62.47%
jan 1, 2009
3.187
+0.129
4.22%
jan 1, 2010
6.103
+2.916
91.52%
jan 1, 2011
6.826
+0.723
11.85%
jan 1, 2012
6.736
-0.09
-1.31%
jan 1, 2013
3.082
-3.654
-54.24%
jan 1, 2014
5.791
+2.709
87.89%
jan 1, 2015
7.885
+2.094
36.16%
jan 1, 2016
8.752
+0.866
10.99%
Ranking of countries by current statistics by years


Comments: