29
/
en
AIzaSyAYiBZKx7MnpbEhh9jyipgxe19OcubqV5w
April 1, 2024
244604
Somalia
SOM
true
2
1
General government final consumption expenditure (annual % growth)
1990,1989,1988,1987,1986,1985,1984,1983,1982,1981,1980,1979,1978,1977,1976,1975,1974,1973,1972,1971,1970,1969,1968,1967,1966,1965,1964,1963,1962
This statistics in other country:
AlbaniaAlgeriaAntigua and BarbudaArab WorldArgentinaArmeniaAustraliaAustriaAzerbaijanBahamas, TheBahrainBangladeshBarbadosBelarusBelgiumBelizeBeninBhutanBoliviaBosnia and HerzegovinaBotswanaBrazilBrunei DarussalamBulgariaBurkina FasoBurundiCabo VerdeCambodiaCameroonCanadaCaribbean small statesCentral Europe and the BalticsChadChileChinaColombiaComorosCongo, Dem. Rep.Congo, Rep.Costa RicaCote d'IvoireCroatiaCubaCyprusCzech RepublicDenmarkDjiboutiDominican RepublicEarly-demographic dividendEast Asia & PacificEast Asia & Pacific (excluding high income)East Asia & Pacific (IDA & IBRD countries)EcuadorEgypt, Arab Rep.El SalvadorEquatorial GuineaEritreaEstoniaEthiopiaEuro areaEurope & Central AsiaEurope & Central Asia (excluding high income)Europe & Central Asia (IDA & IBRD countries)European UnionFijiFinlandFranceGabonGambia, TheGeorgiaGermanyGhanaGreeceGuatemalaGuineaGuinea-BissauHaitiHeavily indebted poor countries (HIPC)High incomeHondurasHong Kong SAR, ChinaHungaryIBRD onlyIcelandIDA & IBRD totalIDA blendIDA onlyIDA totalIndiaIndonesiaIran, Islamic Rep.IrelandIsraelItalyJamaicaJapanJordanKazakhstanKenyaKorea, Rep.KosovoKuwaitKyrgyz RepublicLao PDRLate-demographic dividendLatin America & Caribbean Latin America & Caribbean (excluding high income)Latin America & the Caribbean (IDA & IBRD countries)LatviaLebanonLiberiaLithuaniaLow & middle incomeLow incomeLower middle incomeLuxembourgMacao SAR, ChinaMacedonia, FYRMadagascarMalawiMalaysiaMaliMaltaMauritaniaMauritiusMexicoMiddle East & North AfricaMiddle East & North Africa (excluding high income)Middle East & North Africa (IDA & IBRD countries)Middle incomeMoldovaMongoliaMontenegroMoroccoMozambiqueNamibiaNepalNetherlandsNew ZealandNicaraguaNigerNigeriaNorth AmericaNorwayOECD membersOmanOther small statesPakistanPanamaPapua New GuineaParaguayPeruPhilippinesPolandPortugalPost-demographic dividendPuerto RicoQatarRomaniaRussian FederationRwandaSaudi ArabiaSenegalSerbiaSeychellesSierra LeoneSingaporeSlovak RepublicSloveniaSmall statesSomaliaSouth AfricaSouth AsiaSouth Asia (IDA & IBRD)South SudanSpainSri LankaSub-Saharan Africa Sub-Saharan Africa (excluding high income)Sub-Saharan Africa (IDA & IBRD countries)SudanSurinameSwazilandSwedenSwitzerlandSyrian Arab RepublicTajikistanTanzaniaThailandTimor-LesteTogoTrinidad and TobagoTunisiaTurkeyTurkmenistanUgandaUkraineUnited Arab EmiratesUnited KingdomUnited StatesUpper middle incomeUruguayVanuatuVenezuela, RBVietnamWest Bank and GazaWorldZimbabwe Timeline:
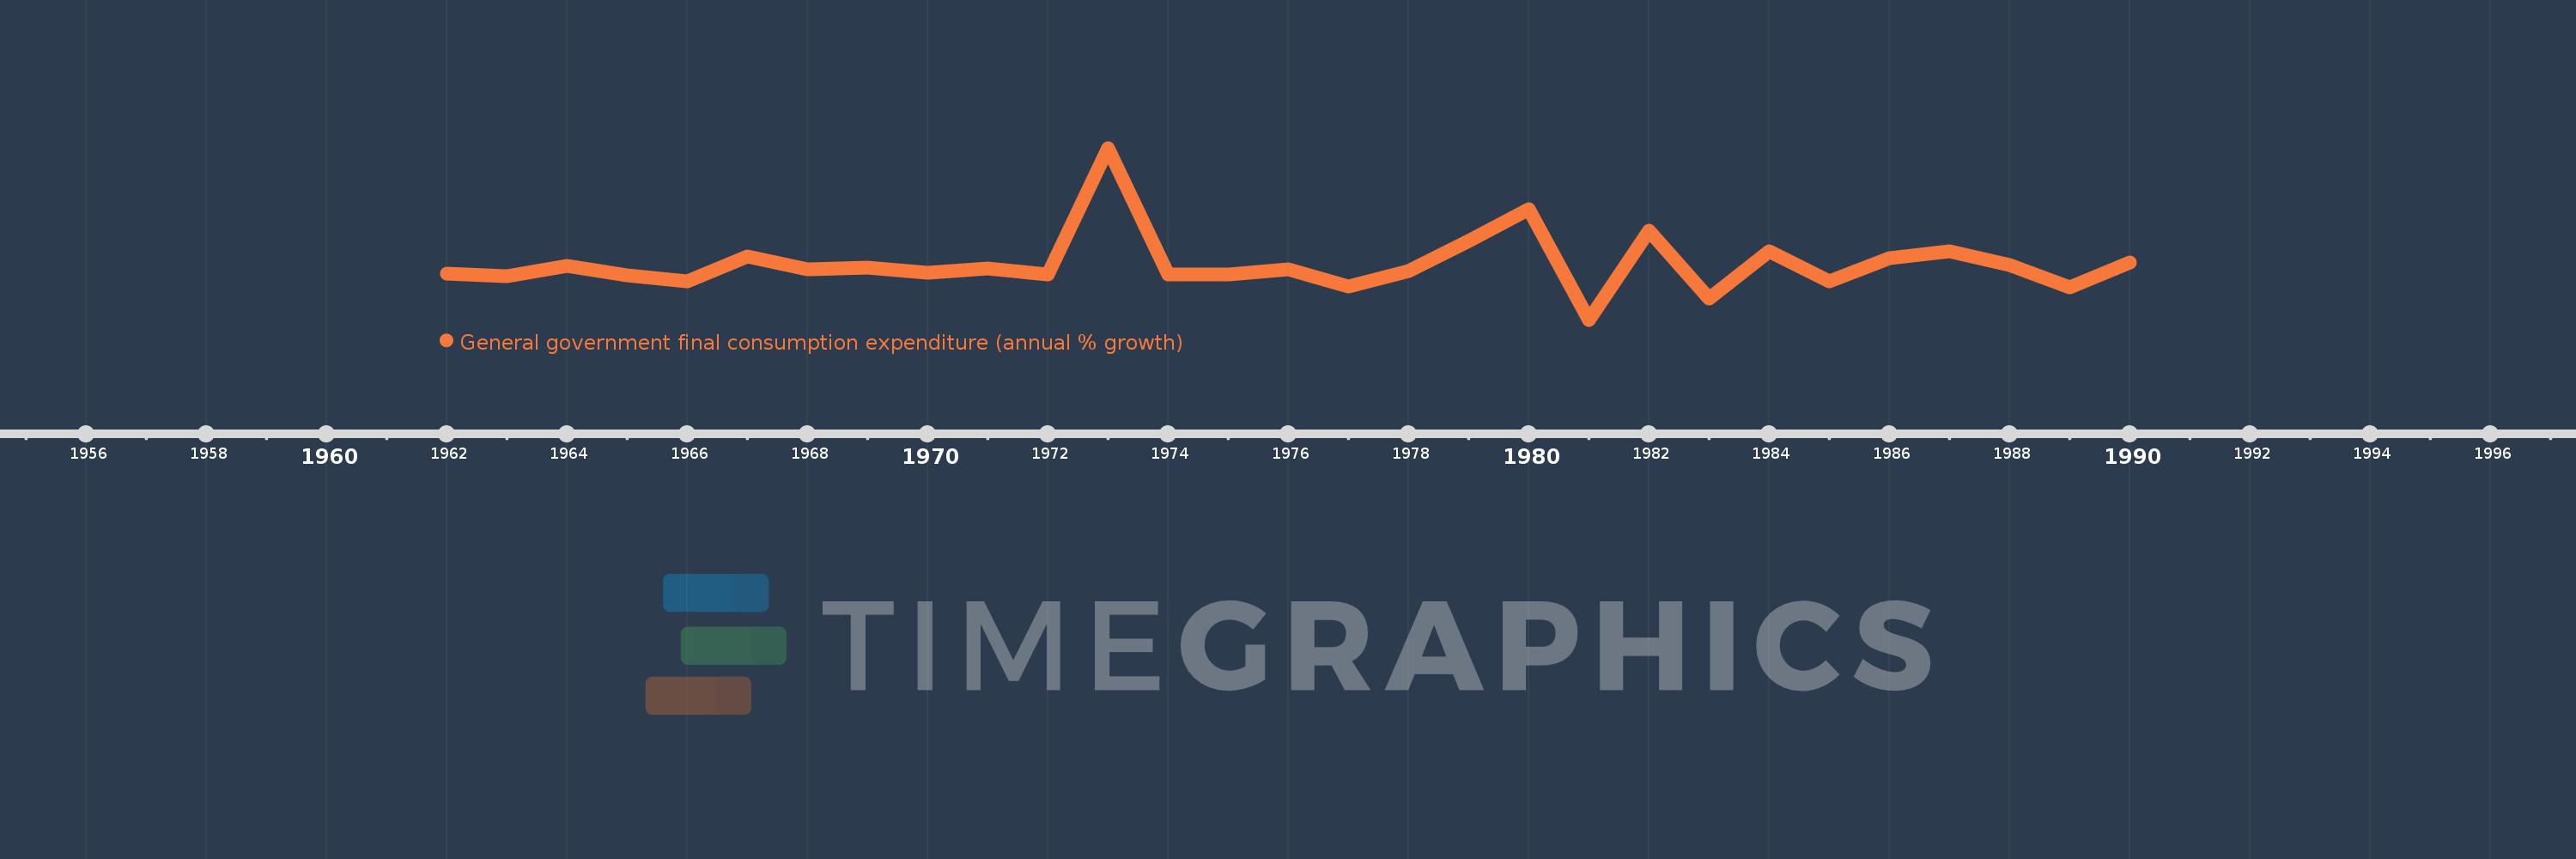
This timeline shows a graph from 1962 to 1990 of Somalia. No data until 1961. Number of actual observations by date: 29.
Source name:
World Development Indicators
Source organization:
World Bank national accounts data, and OECD National Accounts data files.
Categories, topics:
Economy & Growth
Last updated:
apr 23, 2017
Indicators value changes by year
Minimum:
-62.43
jan 1, 1981
Maximum:
168.674
jan 1, 1973
At the date of observation
Value
Absolute change
Change from previous value
jan 1, 1962
-0.363
-0.363
0.0%
jan 1, 1963
-3.567
-3.204
882.93%
jan 1, 1964
10.442
+14.009
-392.78%
jan 1, 1965
-2.201
-12.643
-121.08%
jan 1, 1966
-10.617
-8.416
382.38%
jan 1, 1967
22.551
+33.167
-312.41%
jan 1, 1968
5.816
-16.734
-74.21%
jan 1, 1969
7.847
+2.031
34.92%
jan 1, 1970
1.065
-6.782
-86.42%
jan 1, 1971
6.774
+5.708
535.77%
jan 1, 1972
-1.292
-8.065
-119.07%
jan 1, 1973
168.674
+169.966
-13.16K%
jan 1, 1974
-2.002
-170.676
-101.19%
jan 1, 1975
-1.573
+0.428
-21.4%
jan 1, 1976
5.153
+6.726
-427.49%
jan 1, 1977
-17.444
-22.597
-438.53%
jan 1, 1978
2.646
+20.09
-115.17%
jan 1, 1979
43.254
+40.609
1.53K%
jan 1, 1980
86.361
+43.107
99.66%
jan 1, 1981
-62.43
-148.791
-172.29%
jan 1, 1982
57.594
+120.024
-192.25%
jan 1, 1983
-33.754
-91.348
-158.61%
jan 1, 1984
29.96
+63.715
-188.76%
jan 1, 1985
-11.176
-41.136
-137.3%
jan 1, 1986
20.409
+31.584
-282.61%
jan 1, 1987
30.032
+9.623
47.15%
jan 1, 1988
11.049
-18.982
-63.21%
jan 1, 1989
-19.107
-30.156
-272.92%
jan 1, 1990
15.2
+34.307
-179.56%
Ranking of countries by current statistics by years


Comments: