29
/
en
AIzaSyAYiBZKx7MnpbEhh9jyipgxe19OcubqV5w
April 1, 2024
107257
Colombia
COL
true
2
1
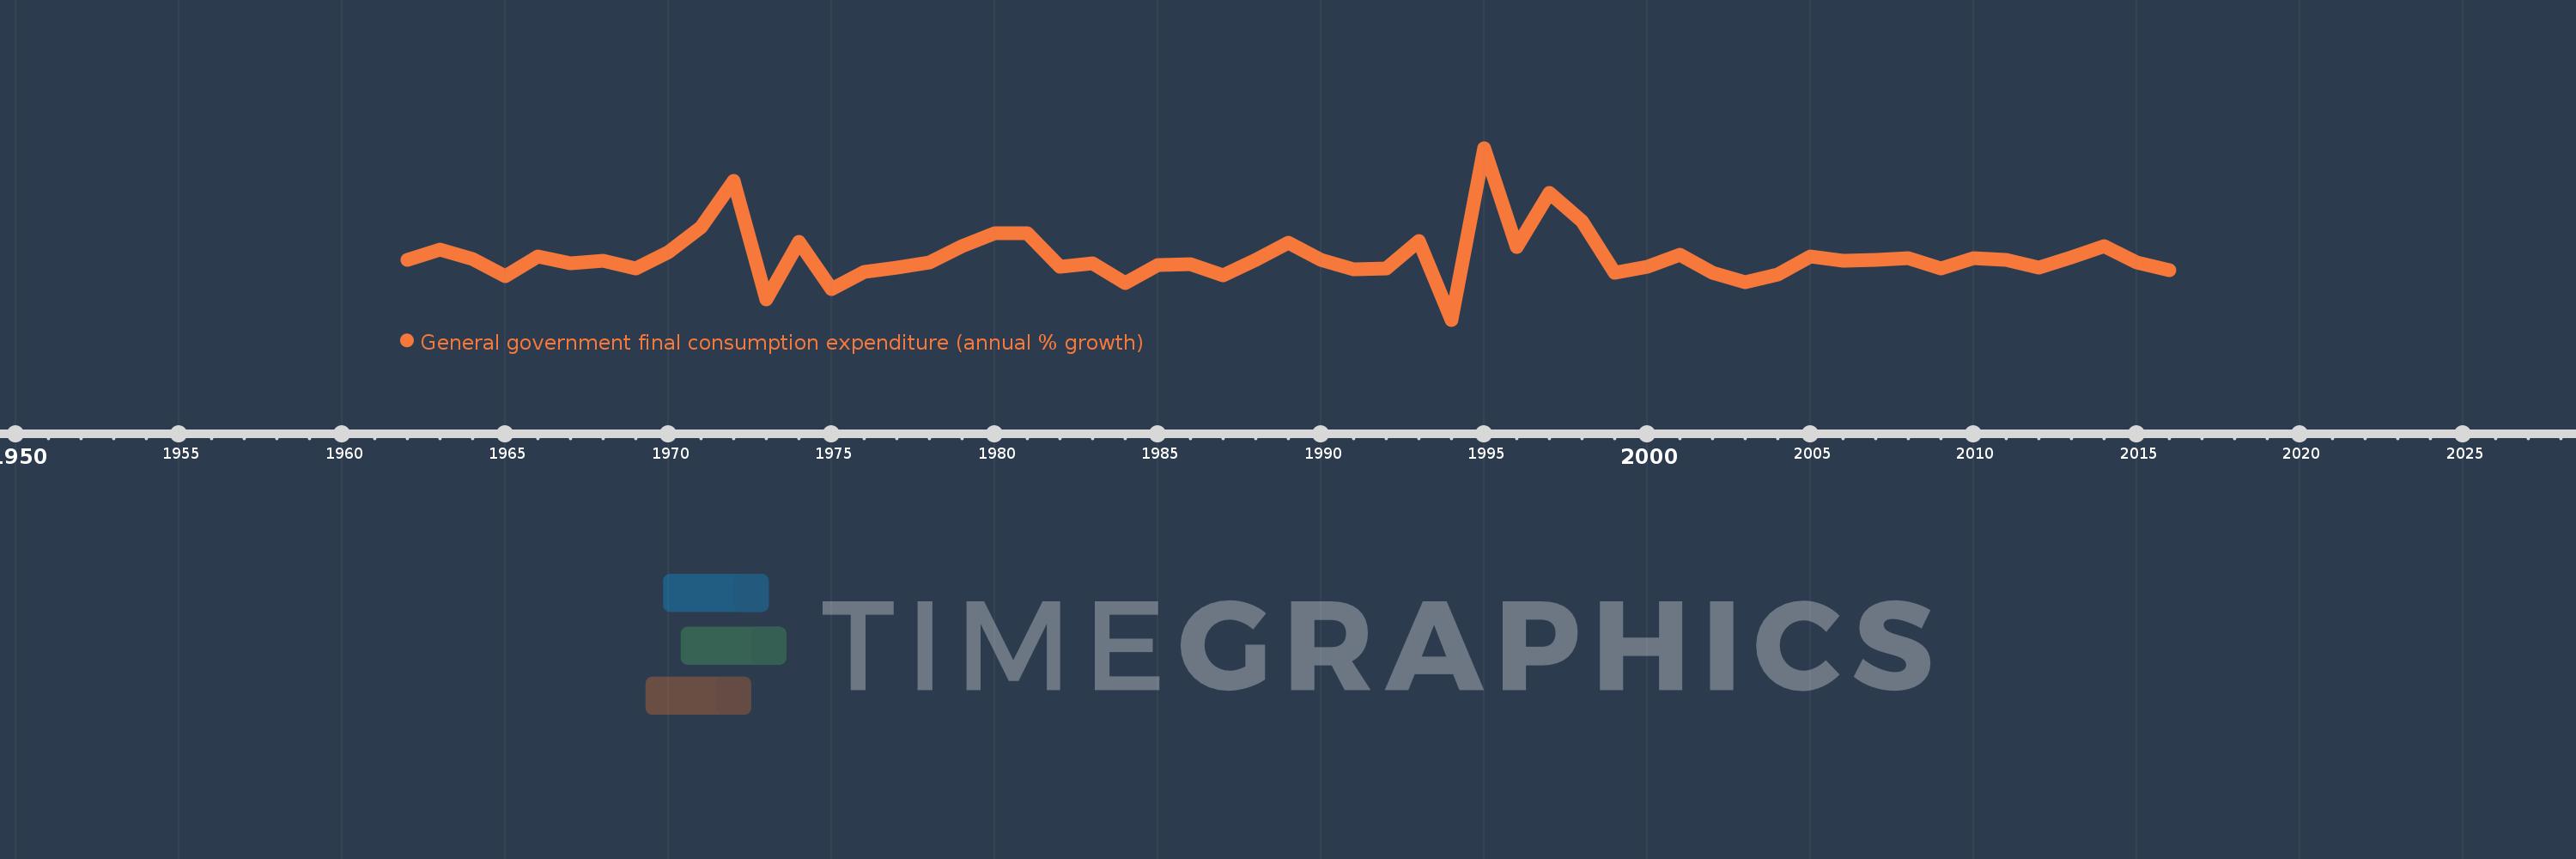
General government final consumption expenditure (annual % growth)
2016,2015,2014,2013,2012,2011,2010,2009,2008,2007,2006,2005,2004,2003,2002,2001,2000,1999,1998,1997,1996,1995,1994,1993,1992,1991,1990,1989,1988,1987,1986,1985,1984,1983,1982,1981,1980,1979,1978,1977,1976,1975,1974,1973,1972,1971,1970,1969,1968,1967,1966,1965,1964,1963,1962
This statistics in other country:
AlbaniaAlgeriaAntigua and BarbudaArab WorldArgentinaArmeniaAustraliaAustriaAzerbaijanBahamas, TheBahrainBangladeshBarbadosBelarusBelgiumBelizeBeninBhutanBoliviaBosnia and HerzegovinaBotswanaBrazilBrunei DarussalamBulgariaBurkina FasoBurundiCabo VerdeCambodiaCameroonCanadaCaribbean small statesCentral Europe and the BalticsChadChileChinaColombiaComorosCongo, Dem. Rep.Congo, Rep.Costa RicaCote d'IvoireCroatiaCubaCyprusCzech RepublicDenmarkDjiboutiDominican RepublicEarly-demographic dividendEast Asia & PacificEast Asia & Pacific (excluding high income)East Asia & Pacific (IDA & IBRD countries)EcuadorEgypt, Arab Rep.El SalvadorEquatorial GuineaEritreaEstoniaEthiopiaEuro areaEurope & Central AsiaEurope & Central Asia (excluding high income)Europe & Central Asia (IDA & IBRD countries)European UnionFijiFinlandFranceGabonGambia, TheGeorgiaGermanyGhanaGreeceGuatemalaGuineaGuinea-BissauHaitiHeavily indebted poor countries (HIPC)High incomeHondurasHong Kong SAR, ChinaHungaryIBRD onlyIcelandIDA & IBRD totalIDA blendIDA onlyIDA totalIndiaIndonesiaIran, Islamic Rep.IrelandIsraelItalyJamaicaJapanJordanKazakhstanKenyaKorea, Rep.KosovoKuwaitKyrgyz RepublicLao PDRLate-demographic dividendLatin America & Caribbean Latin America & Caribbean (excluding high income)Latin America & the Caribbean (IDA & IBRD countries)LatviaLebanonLiberiaLithuaniaLow & middle incomeLow incomeLower middle incomeLuxembourgMacao SAR, ChinaMacedonia, FYRMadagascarMalawiMalaysiaMaliMaltaMauritaniaMauritiusMexicoMiddle East & North AfricaMiddle East & North Africa (excluding high income)Middle East & North Africa (IDA & IBRD countries)Middle incomeMoldovaMongoliaMontenegroMoroccoMozambiqueNamibiaNepalNetherlandsNew ZealandNicaraguaNigerNigeriaNorth AmericaNorwayOECD membersOmanOther small statesPakistanPanamaPapua New GuineaParaguayPeruPhilippinesPolandPortugalPost-demographic dividendPuerto RicoQatarRomaniaRussian FederationRwandaSaudi ArabiaSenegalSerbiaSeychellesSierra LeoneSingaporeSlovak RepublicSloveniaSmall statesSomaliaSouth AfricaSouth AsiaSouth Asia (IDA & IBRD)South SudanSpainSri LankaSub-Saharan Africa Sub-Saharan Africa (excluding high income)Sub-Saharan Africa (IDA & IBRD countries)SudanSurinameSwazilandSwedenSwitzerlandSyrian Arab RepublicTajikistanTanzaniaThailandTimor-LesteTogoTrinidad and TobagoTunisiaTurkeyTurkmenistanUgandaUkraineUnited Arab EmiratesUnited KingdomUnited StatesUpper middle incomeUruguayVanuatuVenezuela, RBVietnamWest Bank and GazaWorldZimbabwe Timeline:
This timeline shows a graph from 1962 to 2016 of Colombia. No data until 1961. Number of actual observations by date: 55.
Source name:
World Development Indicators
Source organization:
World Bank national accounts data, and OECD National Accounts data files.
Categories, topics:
Economy & Growth
Last updated:
apr 23, 2017
Indicators value changes by year
Minimum:
-10.226
jan 1, 1994
Maximum:
34.983
jan 1, 1995
At the date of observation
Value
Absolute change
Change from previous value
jan 1, 1962
5.493
+5.493
0.0%
jan 1, 1963
8.348
+2.855
51.97%
jan 1, 1964
5.763
-2.585
-30.97%
jan 1, 1965
1.346
-4.417
-76.65%
jan 1, 1966
6.514
+5.168
384.09%
jan 1, 1967
4.615
-1.899
-29.15%
jan 1, 1968
5.392
+0.777
16.83%
jan 1, 1969
3.256
-2.136
-39.62%
jan 1, 1970
7.658
+4.402
135.2%
jan 1, 1971
14.226
+6.568
85.77%
jan 1, 1972
26.374
+12.148
85.39%
jan 1, 1973
-4.928
-31.301
-118.68%
jan 1, 1974
10.366
+15.293
-310.37%
jan 1, 1975
-2.21
-12.576
-121.32%
jan 1, 1976
2.26
+4.47
-202.26%
jan 1, 1977
3.591
+1.331
58.91%
jan 1, 1978
4.8
+1.209
33.66%
jan 1, 1979
9.16
+4.36
90.84%
jan 1, 1980
12.587
+3.427
37.41%
jan 1, 1981
12.629
+0.042
0.33%
jan 1, 1982
3.676
-8.953
-70.89%
jan 1, 1983
4.61
+0.933
25.39%
jan 1, 1984
-0.508
-5.118
-111.03%
jan 1, 1985
4.089
+4.597
-904.09%
jan 1, 1986
4.419
+0.33
8.08%
jan 1, 1987
1.411
-3.008
-68.08%
jan 1, 1988
5.564
+4.153
294.44%
jan 1, 1989
9.956
+4.392
78.93%
jan 1, 1990
5.593
-4.364
-43.83%
jan 1, 1991
3.026
-2.566
-45.88%
jan 1, 1992
3.305
+0.278
9.19%
jan 1, 1993
10.545
+7.24
219.09%
jan 1, 1994
-10.226
-20.771
-196.97%
jan 1, 1995
34.983
+45.209
-442.11%
jan 1, 1996
8.999
-25.985
-74.28%
jan 1, 1997
23.111
+14.112
156.83%
jan 1, 1998
15.621
-7.49
-32.41%
jan 1, 1999
2.138
-13.482
-86.31%
jan 1, 2000
3.743
+1.604
75.02%
jan 1, 2001
6.914
+3.171
84.73%
jan 1, 2002
2.192
-4.722
-68.3%
jan 1, 2003
-0.45
-2.641
-120.52%
jan 1, 2004
1.769
+2.219
-493.44%
jan 1, 2005
6.326
+4.556
257.5%
jan 1, 2006
5.213
-1.113
-17.59%
jan 1, 2007
5.603
+0.39
7.49%
jan 1, 2008
6.0
+0.397
7.08%
jan 1, 2009
3.271
-2.729
-45.49%
jan 1, 2010
5.872
+2.601
79.53%
jan 1, 2011
5.621
-0.251
-4.27%
jan 1, 2012
3.574
-2.047
-36.42%
jan 1, 2013
6.301
+2.727
76.28%
jan 1, 2014
9.234
+2.934
46.56%
jan 1, 2015
4.748
-4.486
-48.58%
jan 1, 2016
2.845
-1.903
-40.08%
Ranking of countries by current statistics by years


Comments: