29
/
en
AIzaSyAYiBZKx7MnpbEhh9jyipgxe19OcubqV5w
April 1, 2024
154610
India
IND
true
2
1
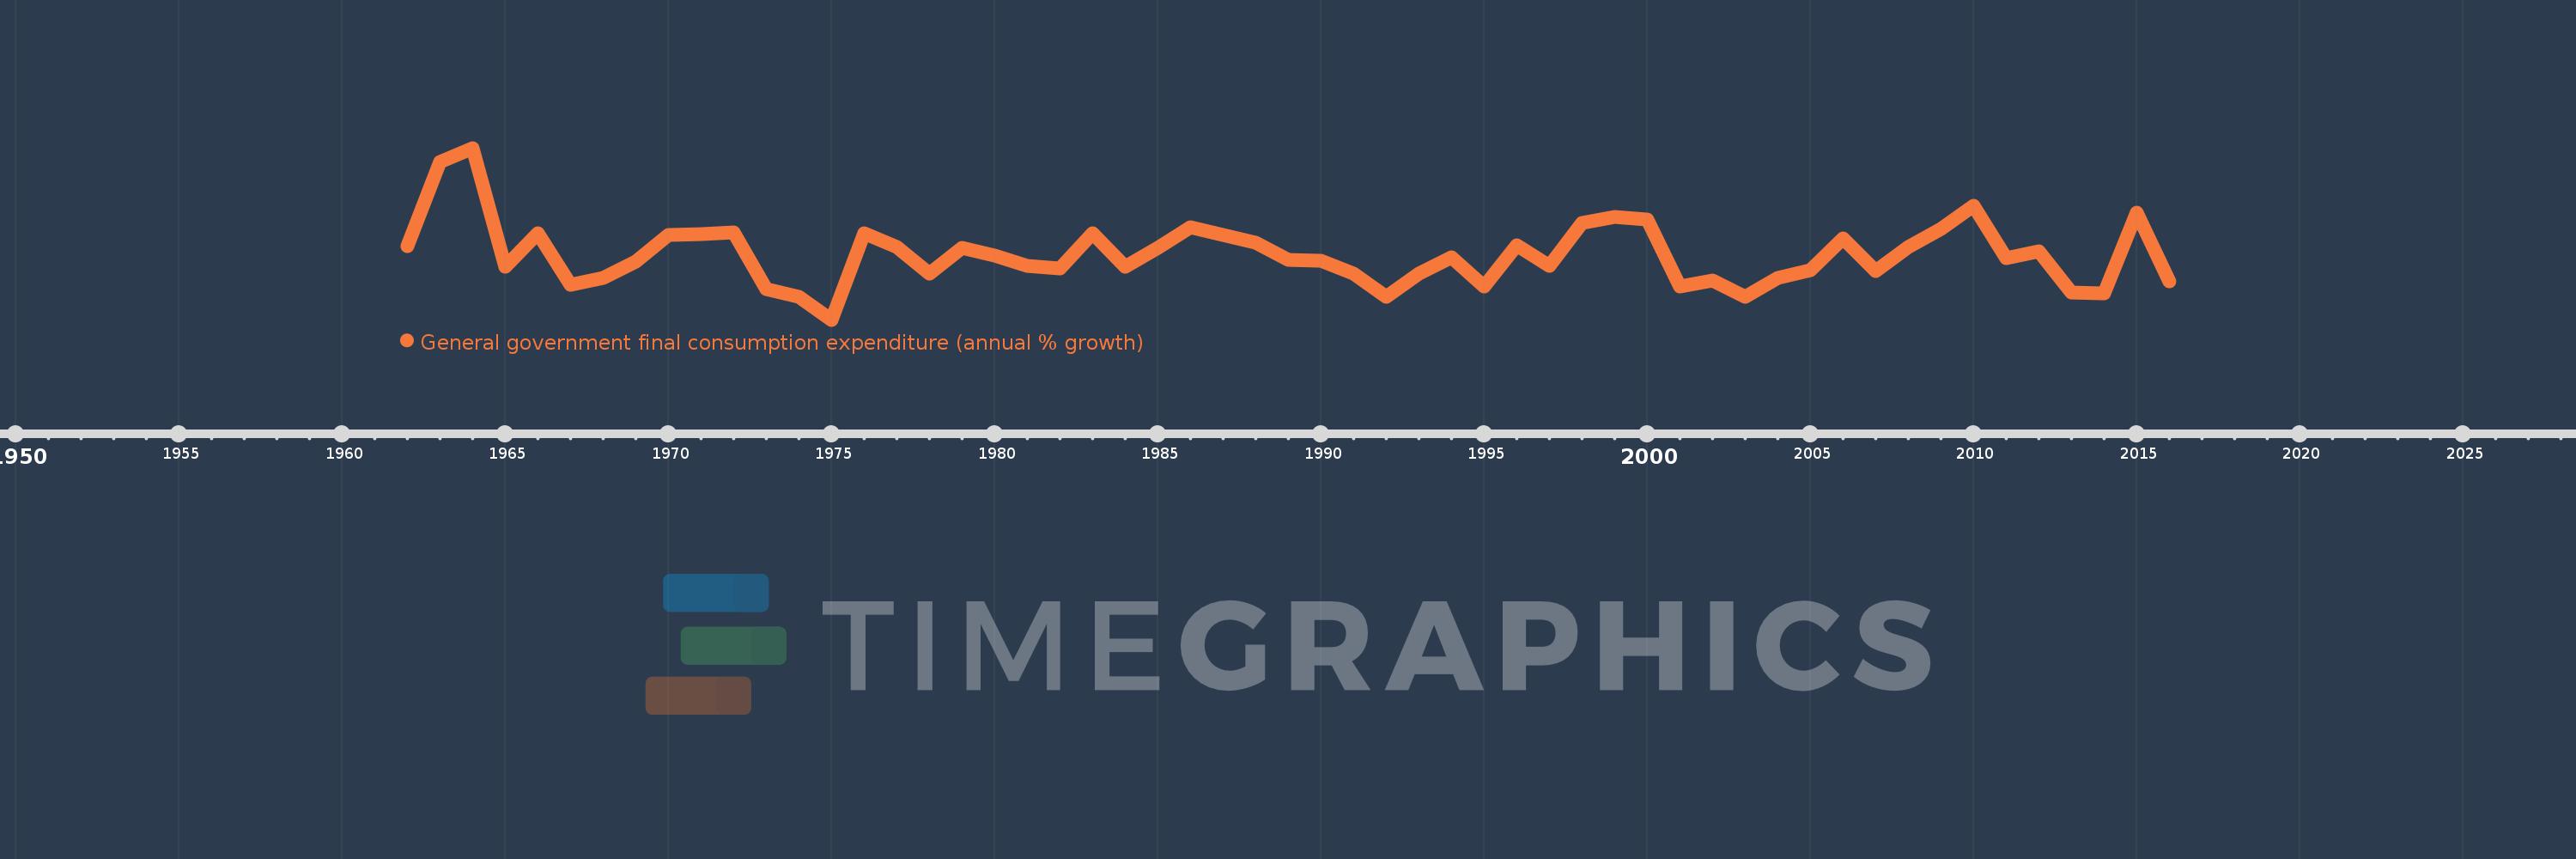
General government final consumption expenditure (annual % growth)
2016,2015,2014,2013,2012,2011,2010,2009,2008,2007,2006,2005,2004,2003,2002,2001,2000,1999,1998,1997,1996,1995,1994,1993,1992,1991,1990,1989,1988,1987,1986,1985,1984,1983,1982,1981,1980,1979,1978,1977,1976,1975,1974,1973,1972,1971,1970,1969,1968,1967,1966,1965,1964,1963,1962
This statistics in other country:
AlbaniaAlgeriaAntigua and BarbudaArab WorldArgentinaArmeniaAustraliaAustriaAzerbaijanBahamas, TheBahrainBangladeshBarbadosBelarusBelgiumBelizeBeninBhutanBoliviaBosnia and HerzegovinaBotswanaBrazilBrunei DarussalamBulgariaBurkina FasoBurundiCabo VerdeCambodiaCameroonCanadaCaribbean small statesCentral Europe and the BalticsChadChileChinaColombiaComorosCongo, Dem. Rep.Congo, Rep.Costa RicaCote d'IvoireCroatiaCubaCyprusCzech RepublicDenmarkDjiboutiDominican RepublicEarly-demographic dividendEast Asia & PacificEast Asia & Pacific (excluding high income)East Asia & Pacific (IDA & IBRD countries)EcuadorEgypt, Arab Rep.El SalvadorEquatorial GuineaEritreaEstoniaEthiopiaEuro areaEurope & Central AsiaEurope & Central Asia (excluding high income)Europe & Central Asia (IDA & IBRD countries)European UnionFijiFinlandFranceGabonGambia, TheGeorgiaGermanyGhanaGreeceGuatemalaGuineaGuinea-BissauHaitiHeavily indebted poor countries (HIPC)High incomeHondurasHong Kong SAR, ChinaHungaryIBRD onlyIcelandIDA & IBRD totalIDA blendIDA onlyIDA totalIndiaIndonesiaIran, Islamic Rep.IrelandIsraelItalyJamaicaJapanJordanKazakhstanKenyaKorea, Rep.KosovoKuwaitKyrgyz RepublicLao PDRLate-demographic dividendLatin America & Caribbean Latin America & Caribbean (excluding high income)Latin America & the Caribbean (IDA & IBRD countries)LatviaLebanonLiberiaLithuaniaLow & middle incomeLow incomeLower middle incomeLuxembourgMacao SAR, ChinaMacedonia, FYRMadagascarMalawiMalaysiaMaliMaltaMauritaniaMauritiusMexicoMiddle East & North AfricaMiddle East & North Africa (excluding high income)Middle East & North Africa (IDA & IBRD countries)Middle incomeMoldovaMongoliaMontenegroMoroccoMozambiqueNamibiaNepalNetherlandsNew ZealandNicaraguaNigerNigeriaNorth AmericaNorwayOECD membersOmanOther small statesPakistanPanamaPapua New GuineaParaguayPeruPhilippinesPolandPortugalPost-demographic dividendPuerto RicoQatarRomaniaRussian FederationRwandaSaudi ArabiaSenegalSerbiaSeychellesSierra LeoneSingaporeSlovak RepublicSloveniaSmall statesSomaliaSouth AfricaSouth AsiaSouth Asia (IDA & IBRD)South SudanSpainSri LankaSub-Saharan Africa Sub-Saharan Africa (excluding high income)Sub-Saharan Africa (IDA & IBRD countries)SudanSurinameSwazilandSwedenSwitzerlandSyrian Arab RepublicTajikistanTanzaniaThailandTimor-LesteTogoTrinidad and TobagoTunisiaTurkeyTurkmenistanUgandaUkraineUnited Arab EmiratesUnited KingdomUnited StatesUpper middle incomeUruguayVanuatuVenezuela, RBVietnamWest Bank and GazaWorldZimbabwe Timeline:
This timeline shows a graph from 1962 to 2016 of India. No data until 1961. Number of actual observations by date: 55.
Source name:
World Development Indicators
Source organization:
World Bank national accounts data, and OECD National Accounts data files.
Categories, topics:
Economy & Growth
Last updated:
apr 23, 2017
Indicators value changes by year
Minimum:
-3.736
jan 1, 1975
Maximum:
22.882
jan 1, 1964
At the date of observation
Value
Absolute change
Change from previous value
jan 1, 1962
7.624
+7.624
0.0%
jan 1, 1963
20.657
+13.033
170.95%
jan 1, 1964
22.882
+2.226
10.77%
jan 1, 1965
4.47
-18.412
-80.46%
jan 1, 1966
9.693
+5.223
116.83%
jan 1, 1967
1.717
-7.975
-82.28%
jan 1, 1968
2.697
+0.98
57.05%
jan 1, 1969
5.247
+2.549
94.52%
jan 1, 1970
9.449
+4.202
80.09%
jan 1, 1971
9.492
+0.042
0.45%
jan 1, 1972
9.803
+0.311
3.28%
jan 1, 1973
0.957
-8.846
-90.24%
jan 1, 1974
-0.14
-1.097
-114.59%
jan 1, 1975
-3.736
-3.596
2.58K%
jan 1, 1976
9.659
+13.395
-358.56%
jan 1, 1977
7.487
-2.173
-22.49%
jan 1, 1978
3.418
-4.068
-54.34%
jan 1, 1979
7.4
+3.981
116.47%
jan 1, 1980
6.257
-1.143
-15.44%
jan 1, 1981
4.64
-1.617
-25.85%
jan 1, 1982
4.209
-0.431
-9.28%
jan 1, 1983
9.621
+5.411
128.56%
jan 1, 1984
4.474
-5.147
-53.5%
jan 1, 1985
7.435
+2.961
66.19%
jan 1, 1986
10.54
+3.105
41.76%
jan 1, 1987
9.402
-1.138
-10.79%
jan 1, 1988
8.194
-1.208
-12.85%
jan 1, 1989
5.481
-2.713
-33.11%
jan 1, 1990
5.344
-0.137
-2.5%
jan 1, 1991
3.397
-1.947
-36.43%
jan 1, 1992
-0.168
-3.565
-104.94%
jan 1, 1993
3.452
+3.62
-2.16K%
jan 1, 1994
5.936
+2.484
71.95%
jan 1, 1995
1.384
-4.552
-76.69%
jan 1, 1996
7.804
+6.42
463.94%
jan 1, 1997
4.641
-3.163
-40.53%
jan 1, 1998
11.252
+6.612
142.48%
jan 1, 1999
12.192
+0.94
8.35%
jan 1, 2000
11.776
-0.416
-3.41%
jan 1, 2001
1.376
-10.401
-88.32%
jan 1, 2002
2.353
+0.977
71.04%
jan 1, 2003
-0.185
-2.539
-107.87%
jan 1, 2004
2.776
+2.961
-1.6K%
jan 1, 2005
3.976
+1.2
43.23%
jan 1, 2006
8.882
+4.906
123.41%
jan 1, 2007
3.775
-5.107
-57.5%
jan 1, 2008
7.48
+3.704
98.13%
jan 1, 2009
10.375
+2.896
38.72%
jan 1, 2010
13.88
+3.505
33.78%
jan 1, 2011
5.772
-8.108
-58.42%
jan 1, 2012
6.86
+1.088
18.85%
jan 1, 2013
0.529
-6.331
-92.29%
jan 1, 2014
0.413
-0.116
-21.89%
jan 1, 2015
12.796
+12.383
3.0K%
jan 1, 2016
2.208
-10.588
-82.75%
Ranking of countries by current statistics by years


Comments: