29
/
en
AIzaSyAYiBZKx7MnpbEhh9jyipgxe19OcubqV5w
April 1, 2024
112258
Costa Rica
CRI
true
2
1
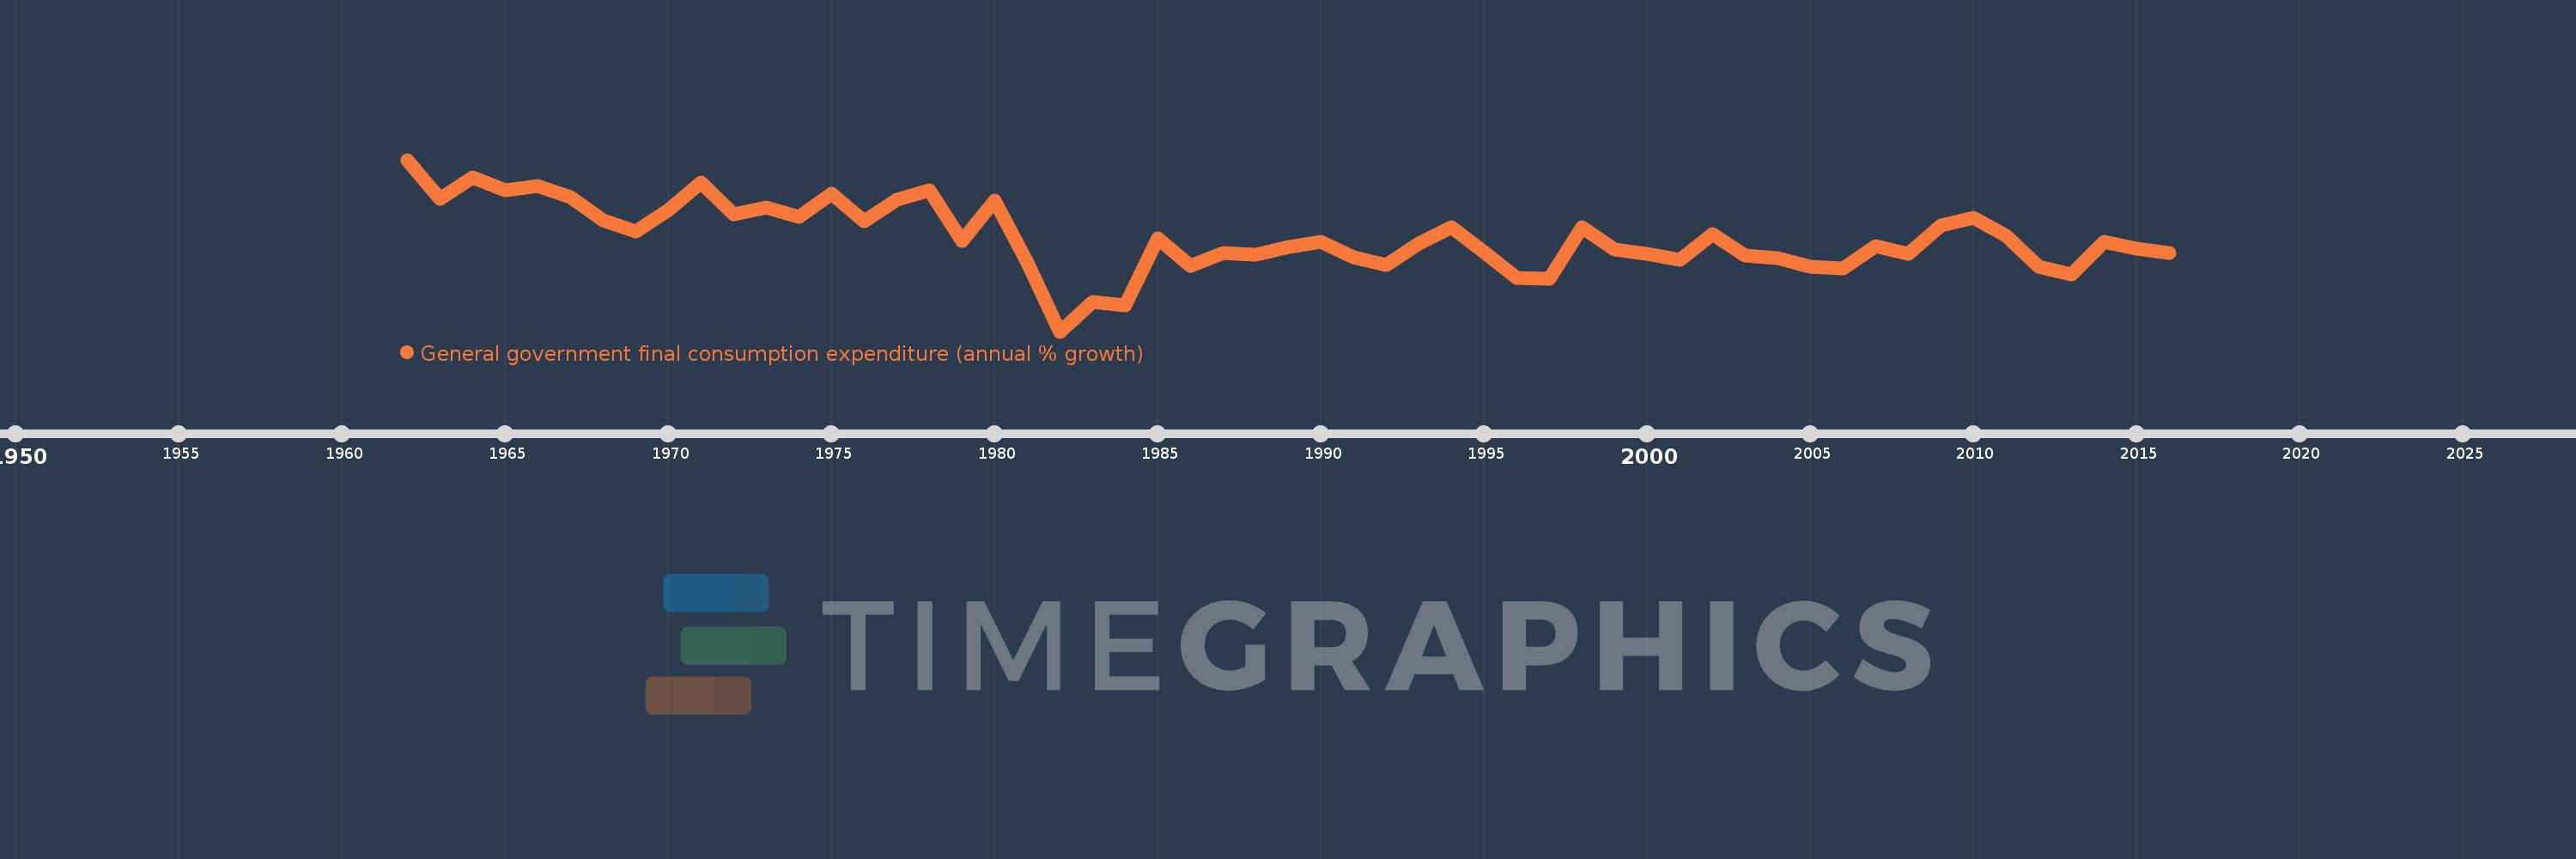
General government final consumption expenditure (annual % growth)
2016,2015,2014,2013,2012,2011,2010,2009,2008,2007,2006,2005,2004,2003,2002,2001,2000,1999,1998,1997,1996,1995,1994,1993,1992,1991,1990,1989,1988,1987,1986,1985,1984,1983,1982,1981,1980,1979,1978,1977,1976,1975,1974,1973,1972,1971,1970,1969,1968,1967,1966,1965,1964,1963,1962
This statistics in other country:
AlbaniaAlgeriaAntigua and BarbudaArab WorldArgentinaArmeniaAustraliaAustriaAzerbaijanBahamas, TheBahrainBangladeshBarbadosBelarusBelgiumBelizeBeninBhutanBoliviaBosnia and HerzegovinaBotswanaBrazilBrunei DarussalamBulgariaBurkina FasoBurundiCabo VerdeCambodiaCameroonCanadaCaribbean small statesCentral Europe and the BalticsChadChileChinaColombiaComorosCongo, Dem. Rep.Congo, Rep.Costa RicaCote d'IvoireCroatiaCubaCyprusCzech RepublicDenmarkDjiboutiDominican RepublicEarly-demographic dividendEast Asia & PacificEast Asia & Pacific (excluding high income)East Asia & Pacific (IDA & IBRD countries)EcuadorEgypt, Arab Rep.El SalvadorEquatorial GuineaEritreaEstoniaEthiopiaEuro areaEurope & Central AsiaEurope & Central Asia (excluding high income)Europe & Central Asia (IDA & IBRD countries)European UnionFijiFinlandFranceGabonGambia, TheGeorgiaGermanyGhanaGreeceGuatemalaGuineaGuinea-BissauHaitiHeavily indebted poor countries (HIPC)High incomeHondurasHong Kong SAR, ChinaHungaryIBRD onlyIcelandIDA & IBRD totalIDA blendIDA onlyIDA totalIndiaIndonesiaIran, Islamic Rep.IrelandIsraelItalyJamaicaJapanJordanKazakhstanKenyaKorea, Rep.KosovoKuwaitKyrgyz RepublicLao PDRLate-demographic dividendLatin America & Caribbean Latin America & Caribbean (excluding high income)Latin America & the Caribbean (IDA & IBRD countries)LatviaLebanonLiberiaLithuaniaLow & middle incomeLow incomeLower middle incomeLuxembourgMacao SAR, ChinaMacedonia, FYRMadagascarMalawiMalaysiaMaliMaltaMauritaniaMauritiusMexicoMiddle East & North AfricaMiddle East & North Africa (excluding high income)Middle East & North Africa (IDA & IBRD countries)Middle incomeMoldovaMongoliaMontenegroMoroccoMozambiqueNamibiaNepalNetherlandsNew ZealandNicaraguaNigerNigeriaNorth AmericaNorwayOECD membersOmanOther small statesPakistanPanamaPapua New GuineaParaguayPeruPhilippinesPolandPortugalPost-demographic dividendPuerto RicoQatarRomaniaRussian FederationRwandaSaudi ArabiaSenegalSerbiaSeychellesSierra LeoneSingaporeSlovak RepublicSloveniaSmall statesSomaliaSouth AfricaSouth AsiaSouth Asia (IDA & IBRD)South SudanSpainSri LankaSub-Saharan Africa Sub-Saharan Africa (excluding high income)Sub-Saharan Africa (IDA & IBRD countries)SudanSurinameSwazilandSwedenSwitzerlandSyrian Arab RepublicTajikistanTanzaniaThailandTimor-LesteTogoTrinidad and TobagoTunisiaTurkeyTurkmenistanUgandaUkraineUnited Arab EmiratesUnited KingdomUnited StatesUpper middle incomeUruguayVanuatuVenezuela, RBVietnamWest Bank and GazaWorldZimbabwe Timeline:
This timeline shows a graph from 1962 to 2016 of Costa Rica. No data until 1961. Number of actual observations by date: 55.
Source name:
World Development Indicators
Source organization:
World Bank national accounts data, and OECD National Accounts data files.
Categories, topics:
Economy & Growth
Last updated:
apr 23, 2017
Indicators value changes by year
Maximum:
11.899
jan 1, 1962
At the date of observation
Value
Absolute change
Change from previous value
jan 1, 1962
11.899
+11.899
0.0%
jan 1, 1963
7.933
-3.966
-33.33%
jan 1, 1964
10.089
+2.157
27.18%
jan 1, 1965
8.806
-1.283
-12.72%
jan 1, 1966
9.259
+0.453
5.14%
jan 1, 1967
8.072
-1.187
-12.82%
jan 1, 1968
5.699
-2.372
-29.39%
jan 1, 1969
4.546
-1.153
-20.23%
jan 1, 1970
6.809
+2.263
49.78%
jan 1, 1971
9.61
+2.801
41.13%
jan 1, 1972
6.363
-3.247
-33.79%
jan 1, 1973
7.038
+0.675
10.61%
jan 1, 1974
6.057
-0.981
-13.94%
jan 1, 1975
8.442
+2.384
39.37%
jan 1, 1976
5.662
-2.779
-32.92%
jan 1, 1977
7.804
+2.142
37.83%
jan 1, 1978
8.755
+0.95
12.18%
jan 1, 1979
3.666
-5.089
-58.13%
jan 1, 1980
7.714
+4.048
110.45%
jan 1, 1981
1.455
-6.259
-81.14%
jan 1, 1982
-5.61
-7.064
-485.65%
jan 1, 1983
-2.548
+3.061
-54.57%
jan 1, 1984
-2.938
-0.39
15.32%
jan 1, 1985
3.887
+6.826
-232.29%
jan 1, 1986
1.056
-2.831
-72.84%
jan 1, 1987
2.399
+1.343
127.2%
jan 1, 1988
2.204
-0.195
-8.13%
jan 1, 1989
3.003
+0.799
36.26%
jan 1, 1990
3.5
+0.497
16.55%
jan 1, 1991
2.0
-1.5
-42.85%
jan 1, 1992
1.2
-0.8
-40.01%
jan 1, 1993
3.331
+2.131
177.54%
jan 1, 1994
5.011
+1.68
50.44%
jan 1, 1995
2.448
-2.563
-51.14%
jan 1, 1996
-0.111
-2.559
-104.54%
jan 1, 1997
-0.198
-0.087
78.64%
jan 1, 1998
5.007
+5.205
-2.62K%
jan 1, 1999
2.764
-2.242
-44.79%
jan 1, 2000
2.277
-0.488
-17.64%
jan 1, 2001
1.72
-0.557
-24.44%
jan 1, 2002
4.319
+2.599
151.08%
jan 1, 2003
2.148
-2.171
-50.27%
jan 1, 2004
1.899
-0.249
-11.61%
jan 1, 2005
0.992
-0.907
-47.77%
jan 1, 2006
0.824
-0.168
-16.92%
jan 1, 2007
3.13
+2.306
279.93%
jan 1, 2008
2.285
-0.845
-27.0%
jan 1, 2009
5.179
+2.894
126.68%
jan 1, 2010
6.022
+0.842
16.27%
jan 1, 2011
4.118
-1.903
-31.61%
jan 1, 2012
0.976
-3.142
-76.3%
jan 1, 2013
0.249
-0.727
-74.52%
jan 1, 2014
3.545
+3.297
1.33K%
jan 1, 2015
2.877
-0.668
-18.85%
jan 1, 2016
2.427
-0.45
-15.63%
Ranking of countries by current statistics by years


Comments: