29
/
en
AIzaSyAYiBZKx7MnpbEhh9jyipgxe19OcubqV5w
April 1, 2024
43436
Latin America & the Caribbean (IDA & IBRD countries)
TLA
false
2
1
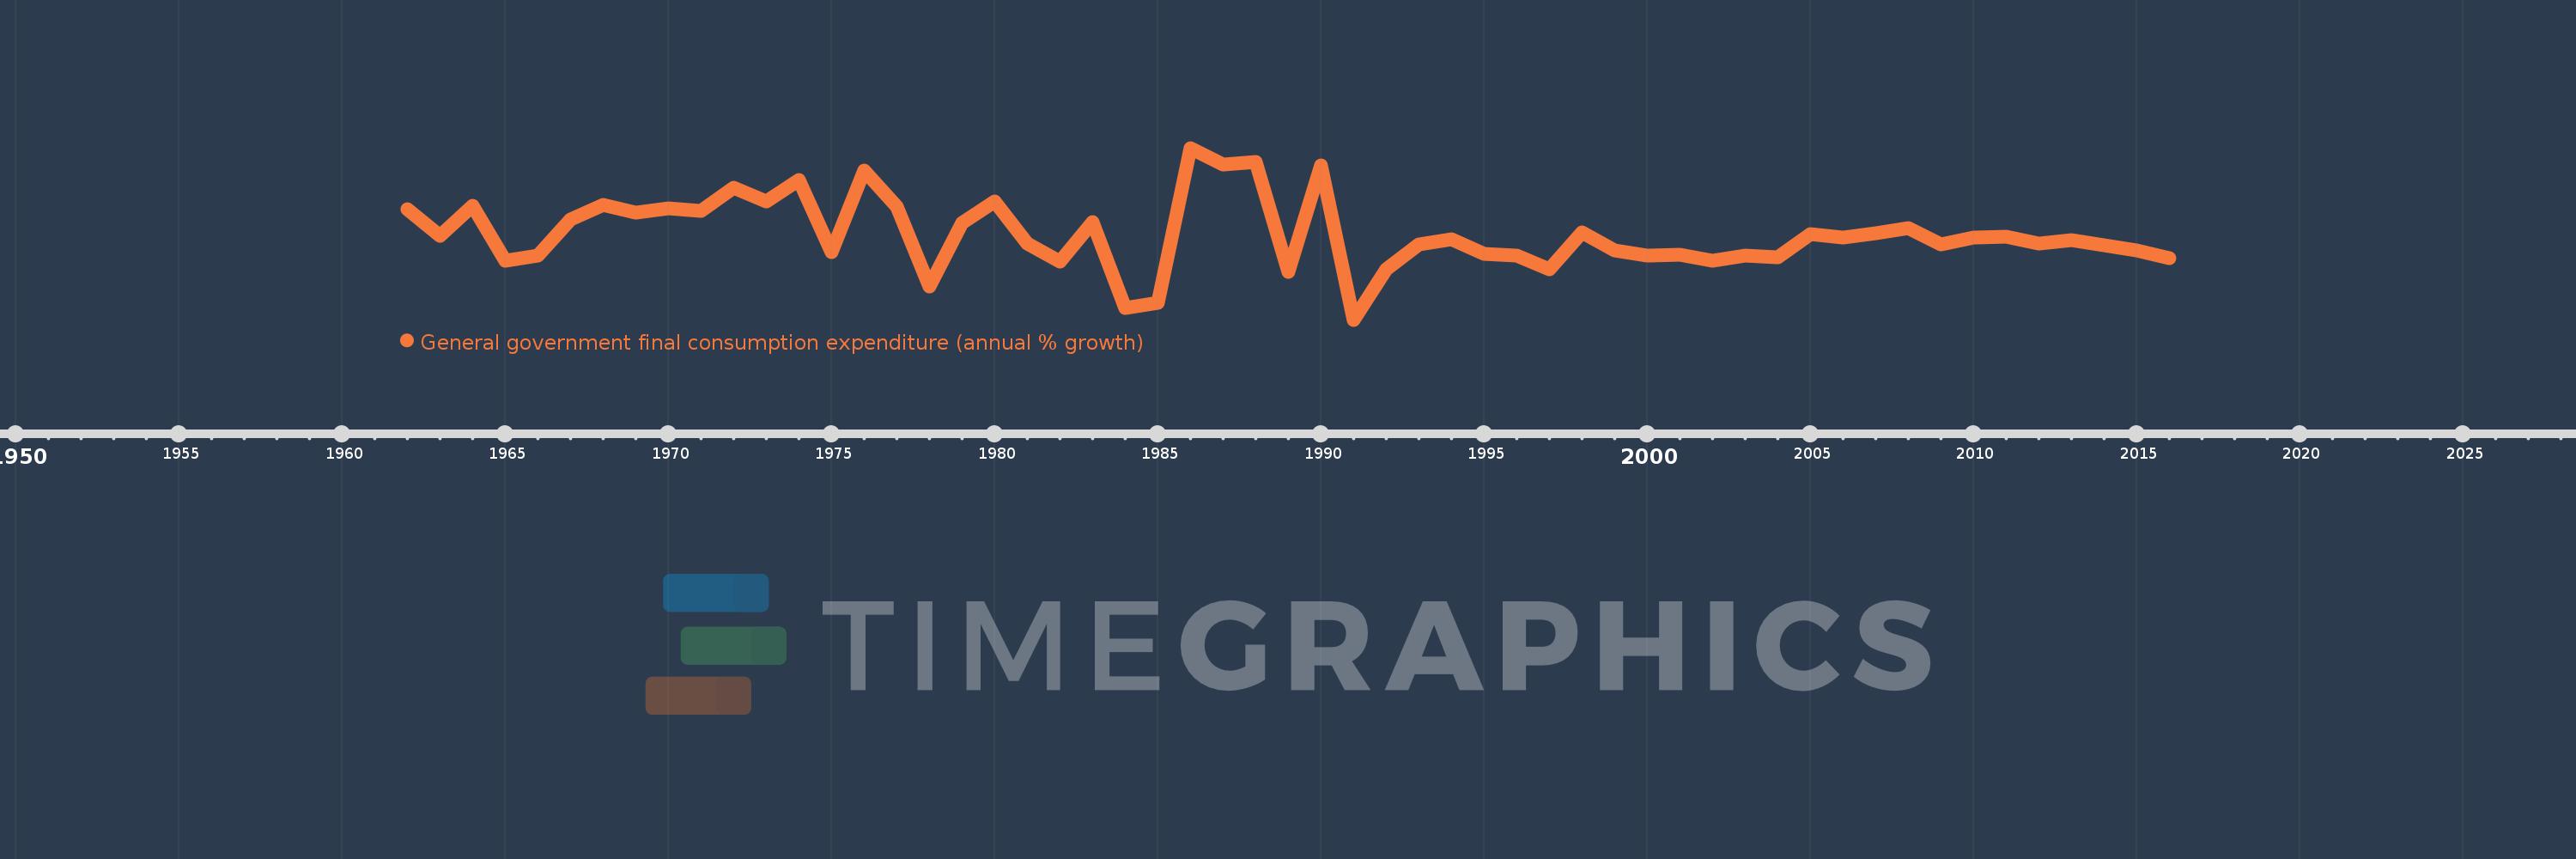
General government final consumption expenditure (annual % growth)
2016,2015,2014,2013,2012,2011,2010,2009,2008,2007,2006,2005,2004,2003,2002,2001,2000,1999,1998,1997,1996,1995,1994,1993,1992,1991,1990,1989,1988,1987,1986,1985,1984,1983,1982,1981,1980,1979,1978,1977,1976,1975,1974,1973,1972,1971,1970,1969,1968,1967,1966,1965,1964,1963,1962
This statistics in other country:
AlbaniaAlgeriaAntigua and BarbudaArab WorldArgentinaArmeniaAustraliaAustriaAzerbaijanBahamas, TheBahrainBangladeshBarbadosBelarusBelgiumBelizeBeninBhutanBoliviaBosnia and HerzegovinaBotswanaBrazilBrunei DarussalamBulgariaBurkina FasoBurundiCabo VerdeCambodiaCameroonCanadaCaribbean small statesCentral Europe and the BalticsChadChileChinaColombiaComorosCongo, Dem. Rep.Congo, Rep.Costa RicaCote d'IvoireCroatiaCubaCyprusCzech RepublicDenmarkDjiboutiDominican RepublicEarly-demographic dividendEast Asia & PacificEast Asia & Pacific (excluding high income)East Asia & Pacific (IDA & IBRD countries)EcuadorEgypt, Arab Rep.El SalvadorEquatorial GuineaEritreaEstoniaEthiopiaEuro areaEurope & Central AsiaEurope & Central Asia (excluding high income)Europe & Central Asia (IDA & IBRD countries)European UnionFijiFinlandFranceGabonGambia, TheGeorgiaGermanyGhanaGreeceGuatemalaGuineaGuinea-BissauHaitiHeavily indebted poor countries (HIPC)High incomeHondurasHong Kong SAR, ChinaHungaryIBRD onlyIcelandIDA & IBRD totalIDA blendIDA onlyIDA totalIndiaIndonesiaIran, Islamic Rep.IrelandIsraelItalyJamaicaJapanJordanKazakhstanKenyaKorea, Rep.KosovoKuwaitKyrgyz RepublicLao PDRLate-demographic dividendLatin America & Caribbean Latin America & Caribbean (excluding high income)Latin America & the Caribbean (IDA & IBRD countries)LatviaLebanonLiberiaLithuaniaLow & middle incomeLow incomeLower middle incomeLuxembourgMacao SAR, ChinaMacedonia, FYRMadagascarMalawiMalaysiaMaliMaltaMauritaniaMauritiusMexicoMiddle East & North AfricaMiddle East & North Africa (excluding high income)Middle East & North Africa (IDA & IBRD countries)Middle incomeMoldovaMongoliaMontenegroMoroccoMozambiqueNamibiaNepalNetherlandsNew ZealandNicaraguaNigerNigeriaNorth AmericaNorwayOECD membersOmanOther small statesPakistanPanamaPapua New GuineaParaguayPeruPhilippinesPolandPortugalPost-demographic dividendPuerto RicoQatarRomaniaRussian FederationRwandaSaudi ArabiaSenegalSerbiaSeychellesSierra LeoneSingaporeSlovak RepublicSloveniaSmall statesSomaliaSouth AfricaSouth AsiaSouth Asia (IDA & IBRD)South SudanSpainSri LankaSub-Saharan Africa Sub-Saharan Africa (excluding high income)Sub-Saharan Africa (IDA & IBRD countries)SudanSurinameSwazilandSwedenSwitzerlandSyrian Arab RepublicTajikistanTanzaniaThailandTimor-LesteTogoTrinidad and TobagoTunisiaTurkeyTurkmenistanUgandaUkraineUnited Arab EmiratesUnited KingdomUnited StatesUpper middle incomeUruguayVanuatuVenezuela, RBVietnamWest Bank and GazaWorldZimbabwe Timeline:
This timeline shows a graph from 1962 to 2016 of Latin America & the Caribbean (IDA & IBRD countries). No data until 1961. Number of actual observations by date: 55.
Source name:
World Development Indicators
Source organization:
World Bank national accounts data, and OECD National Accounts data files.
Categories, topics:
Economy & Growth
Last updated:
apr 23, 2017
Indicators value changes by year
Minimum:
-6.037
jan 1, 1991
Maximum:
14.244
jan 1, 1986
At the date of observation
Value
Absolute change
Change from previous value
jan 1, 1962
6.986
+6.986
0.0%
jan 1, 1963
3.833
-3.153
-45.13%
jan 1, 1964
7.437
+3.604
94.02%
jan 1, 1965
0.962
-6.475
-87.07%
jan 1, 1966
1.516
+0.554
57.59%
jan 1, 1967
5.84
+4.324
285.27%
jan 1, 1968
7.498
+1.658
28.39%
jan 1, 1969
6.564
-0.934
-12.46%
jan 1, 1970
7.074
+0.51
7.77%
jan 1, 1971
6.81
-0.264
-3.73%
jan 1, 1972
9.529
+2.719
39.92%
jan 1, 1973
7.952
-1.577
-16.55%
jan 1, 1974
10.426
+2.474
31.12%
jan 1, 1975
1.989
-8.437
-80.92%
jan 1, 1976
11.58
+9.59
482.05%
jan 1, 1977
7.328
-4.252
-36.72%
jan 1, 1978
-2.11
-9.438
-128.8%
jan 1, 1979
5.382
+7.493
-355.04%
jan 1, 1980
7.894
+2.511
46.66%
jan 1, 1981
2.969
-4.925
-62.39%
jan 1, 1982
0.849
-2.12
-71.4%
jan 1, 1983
5.47
+4.62
544.11%
jan 1, 1984
-4.67
-10.139
-185.38%
jan 1, 1985
-4.021
+0.648
-13.88%
jan 1, 1986
14.244
+18.265
-454.2%
jan 1, 1987
12.299
-1.945
-13.66%
jan 1, 1988
12.567
+0.268
2.18%
jan 1, 1989
-0.377
-12.943
-103.0%
jan 1, 1990
12.181
+12.558
-3.33K%
jan 1, 1991
-6.037
-18.218
-149.55%
jan 1, 1992
-0.052
+5.985
-99.15%
jan 1, 1993
2.83
+2.882
-5.59K%
jan 1, 1994
3.42
+0.589
20.81%
jan 1, 1995
1.726
-1.693
-49.51%
jan 1, 1996
1.58
-0.146
-8.46%
jan 1, 1997
-0.046
-1.626
-102.89%
jan 1, 1998
4.24
+4.286
-9.38K%
jan 1, 1999
2.098
-2.142
-50.51%
jan 1, 2000
1.559
-0.539
-25.71%
jan 1, 2001
1.59
+0.031
1.98%
jan 1, 2002
0.926
-0.664
-41.77%
jan 1, 2003
1.575
+0.649
70.16%
jan 1, 2004
1.311
-0.264
-16.76%
jan 1, 2005
4.104
+2.793
213.01%
jan 1, 2006
3.706
-0.398
-9.7%
jan 1, 2007
4.155
+0.45
12.13%
jan 1, 2008
4.831
+0.676
16.26%
jan 1, 2009
2.906
-1.925
-39.85%
jan 1, 2010
3.686
+0.78
26.86%
jan 1, 2011
3.737
+0.05
1.36%
jan 1, 2012
2.914
-0.823
-22.02%
jan 1, 2013
3.413
+0.499
17.13%
jan 1, 2014
2.746
-0.666
-19.52%
jan 1, 2015
2.128
-0.618
-22.52%
jan 1, 2016
1.209
-0.919
-43.18%
Ranking of countries by current statistics by years


Comments: