29
/
en
AIzaSyAYiBZKx7MnpbEhh9jyipgxe19OcubqV5w
April 1, 2024
257316
Switzerland
CHE
true
2
1
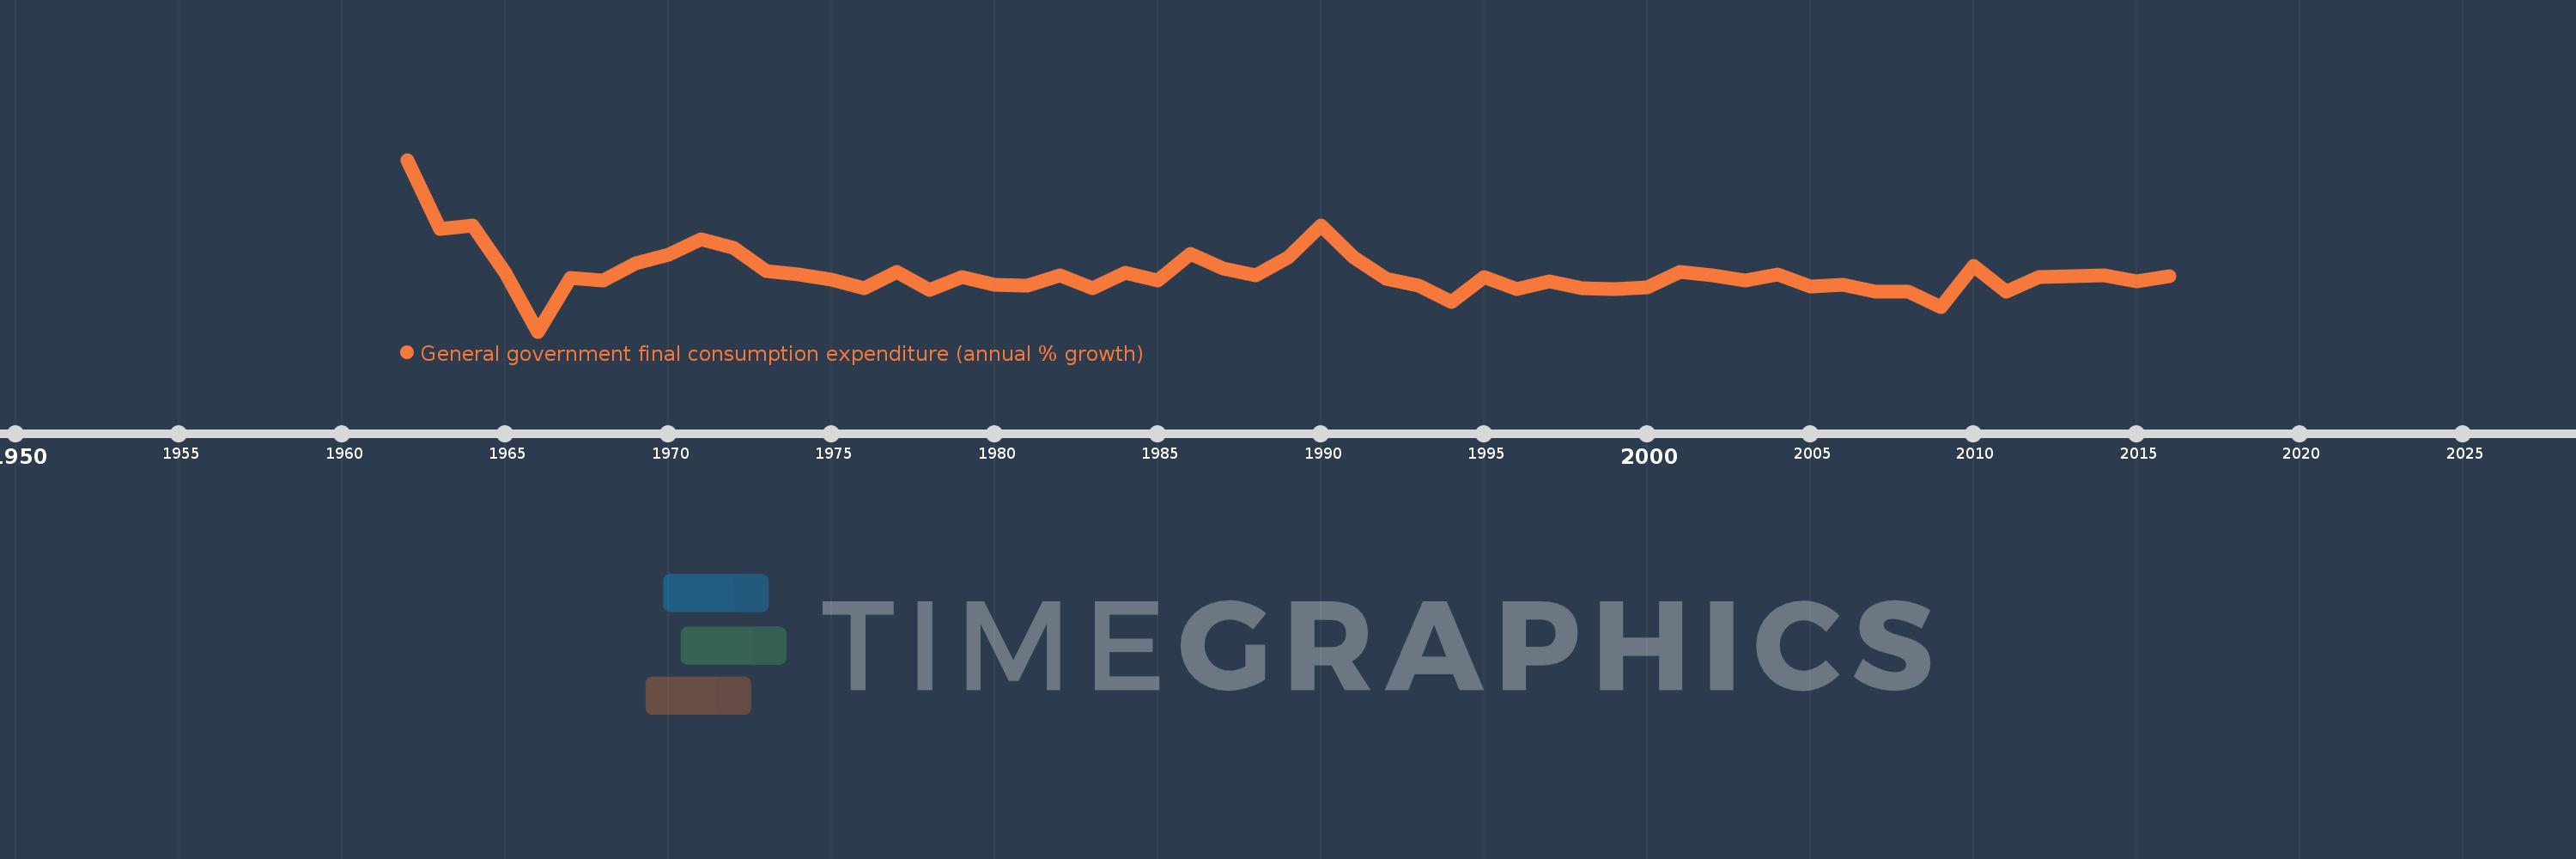
General government final consumption expenditure (annual % growth)
2016,2015,2014,2013,2012,2011,2010,2009,2008,2007,2006,2005,2004,2003,2002,2001,2000,1999,1998,1997,1996,1995,1994,1993,1992,1991,1990,1989,1988,1987,1986,1985,1984,1983,1982,1981,1980,1979,1978,1977,1976,1975,1974,1973,1972,1971,1970,1969,1968,1967,1966,1965,1964,1963,1962
This statistics in other country:
AlbaniaAlgeriaAntigua and BarbudaArab WorldArgentinaArmeniaAustraliaAustriaAzerbaijanBahamas, TheBahrainBangladeshBarbadosBelarusBelgiumBelizeBeninBhutanBoliviaBosnia and HerzegovinaBotswanaBrazilBrunei DarussalamBulgariaBurkina FasoBurundiCabo VerdeCambodiaCameroonCanadaCaribbean small statesCentral Europe and the BalticsChadChileChinaColombiaComorosCongo, Dem. Rep.Congo, Rep.Costa RicaCote d'IvoireCroatiaCubaCyprusCzech RepublicDenmarkDjiboutiDominican RepublicEarly-demographic dividendEast Asia & PacificEast Asia & Pacific (excluding high income)East Asia & Pacific (IDA & IBRD countries)EcuadorEgypt, Arab Rep.El SalvadorEquatorial GuineaEritreaEstoniaEthiopiaEuro areaEurope & Central AsiaEurope & Central Asia (excluding high income)Europe & Central Asia (IDA & IBRD countries)European UnionFijiFinlandFranceGabonGambia, TheGeorgiaGermanyGhanaGreeceGuatemalaGuineaGuinea-BissauHaitiHeavily indebted poor countries (HIPC)High incomeHondurasHong Kong SAR, ChinaHungaryIBRD onlyIcelandIDA & IBRD totalIDA blendIDA onlyIDA totalIndiaIndonesiaIran, Islamic Rep.IrelandIsraelItalyJamaicaJapanJordanKazakhstanKenyaKorea, Rep.KosovoKuwaitKyrgyz RepublicLao PDRLate-demographic dividendLatin America & Caribbean Latin America & Caribbean (excluding high income)Latin America & the Caribbean (IDA & IBRD countries)LatviaLebanonLiberiaLithuaniaLow & middle incomeLow incomeLower middle incomeLuxembourgMacao SAR, ChinaMacedonia, FYRMadagascarMalawiMalaysiaMaliMaltaMauritaniaMauritiusMexicoMiddle East & North AfricaMiddle East & North Africa (excluding high income)Middle East & North Africa (IDA & IBRD countries)Middle incomeMoldovaMongoliaMontenegroMoroccoMozambiqueNamibiaNepalNetherlandsNew ZealandNicaraguaNigerNigeriaNorth AmericaNorwayOECD membersOmanOther small statesPakistanPanamaPapua New GuineaParaguayPeruPhilippinesPolandPortugalPost-demographic dividendPuerto RicoQatarRomaniaRussian FederationRwandaSaudi ArabiaSenegalSerbiaSeychellesSierra LeoneSingaporeSlovak RepublicSloveniaSmall statesSomaliaSouth AfricaSouth AsiaSouth Asia (IDA & IBRD)South SudanSpainSri LankaSub-Saharan Africa Sub-Saharan Africa (excluding high income)Sub-Saharan Africa (IDA & IBRD countries)SudanSurinameSwazilandSwedenSwitzerlandSyrian Arab RepublicTajikistanTanzaniaThailandTimor-LesteTogoTrinidad and TobagoTunisiaTurkeyTurkmenistanUgandaUkraineUnited Arab EmiratesUnited KingdomUnited StatesUpper middle incomeUruguayVanuatuVenezuela, RBVietnamWest Bank and GazaWorldZimbabwe Timeline:
This timeline shows a graph from 1962 to 2016 of Switzerland. No data until 1961. Number of actual observations by date: 55.
Source name:
World Development Indicators
Source organization:
World Bank national accounts data, and OECD National Accounts data files.
Categories, topics:
Economy & Growth
Last updated:
apr 23, 2017
Indicators value changes by year
Minimum:
-4.997
jan 1, 1966
Maximum:
17.239
jan 1, 1962
At the date of observation
Value
Absolute change
Change from previous value
jan 1, 1962
17.239
+17.239
0.0%
jan 1, 1963
8.251
-8.988
-52.14%
jan 1, 1964
8.718
+0.467
5.66%
jan 1, 1965
2.672
-6.047
-69.36%
jan 1, 1966
-4.997
-7.669
-287.05%
jan 1, 1967
1.992
+6.989
-139.86%
jan 1, 1968
1.59
-0.402
-20.18%
jan 1, 1969
3.84
+2.251
141.56%
jan 1, 1970
4.916
+1.075
28.0%
jan 1, 1971
6.915
+1.999
40.67%
jan 1, 1972
5.839
-1.076
-15.56%
jan 1, 1973
2.883
-2.956
-50.63%
jan 1, 1974
2.415
-0.467
-16.21%
jan 1, 1975
1.698
-0.717
-29.7%
jan 1, 1976
0.649
-1.049
-61.76%
jan 1, 1977
2.765
+2.116
325.81%
jan 1, 1978
0.404
-2.361
-85.4%
jan 1, 1979
2.01
+1.606
397.99%
jan 1, 1980
1.051
-0.959
-47.72%
jan 1, 1981
0.953
-0.098
-9.29%
jan 1, 1982
2.278
+1.325
138.99%
jan 1, 1983
0.634
-1.644
-72.15%
jan 1, 1984
2.607
+1.973
310.9%
jan 1, 1985
1.568
-1.039
-39.87%
jan 1, 1986
5.12
+3.552
226.57%
jan 1, 1987
3.21
-1.909
-37.3%
jan 1, 1988
2.307
-0.903
-28.13%
jan 1, 1989
4.567
+2.259
97.93%
jan 1, 1990
8.766
+4.199
91.96%
jan 1, 1991
4.646
-4.12
-47.0%
jan 1, 1992
1.881
-2.765
-59.51%
jan 1, 1993
0.903
-0.979
-52.02%
jan 1, 1994
-1.181
-2.083
-230.81%
jan 1, 1995
2.105
+3.286
-278.34%
jan 1, 1996
0.491
-1.614
-76.66%
jan 1, 1997
1.545
+1.054
214.41%
jan 1, 1998
0.619
-0.926
-59.93%
jan 1, 1999
0.476
-0.143
-23.17%
jan 1, 2000
0.694
+0.219
45.97%
jan 1, 2001
2.679
+1.985
285.83%
jan 1, 2002
2.255
-0.424
-15.84%
jan 1, 2003
1.632
-0.623
-27.64%
jan 1, 2004
2.371
+0.739
45.32%
jan 1, 2005
0.797
-1.574
-66.38%
jan 1, 2006
1.085
+0.288
36.17%
jan 1, 2007
0.147
-0.938
-86.43%
jan 1, 2008
0.132
-0.015
-10.1%
jan 1, 2009
-1.877
-2.01
-1.52K%
jan 1, 2010
3.531
+5.408
-288.09%
jan 1, 2011
0.2
-3.33
-94.32%
jan 1, 2012
2.069
+1.869
932.23%
jan 1, 2013
2.149
+0.08
3.86%
jan 1, 2014
2.3
+0.151
7.05%
jan 1, 2015
1.474
-0.826
-35.91%
jan 1, 2016
2.151
+0.677
45.9%
Ranking of countries by current statistics by years


Comments: