29
/
en
AIzaSyAYiBZKx7MnpbEhh9jyipgxe19OcubqV5w
April 1, 2024
266851
Trinidad and Tobago
TTO
true
2
1
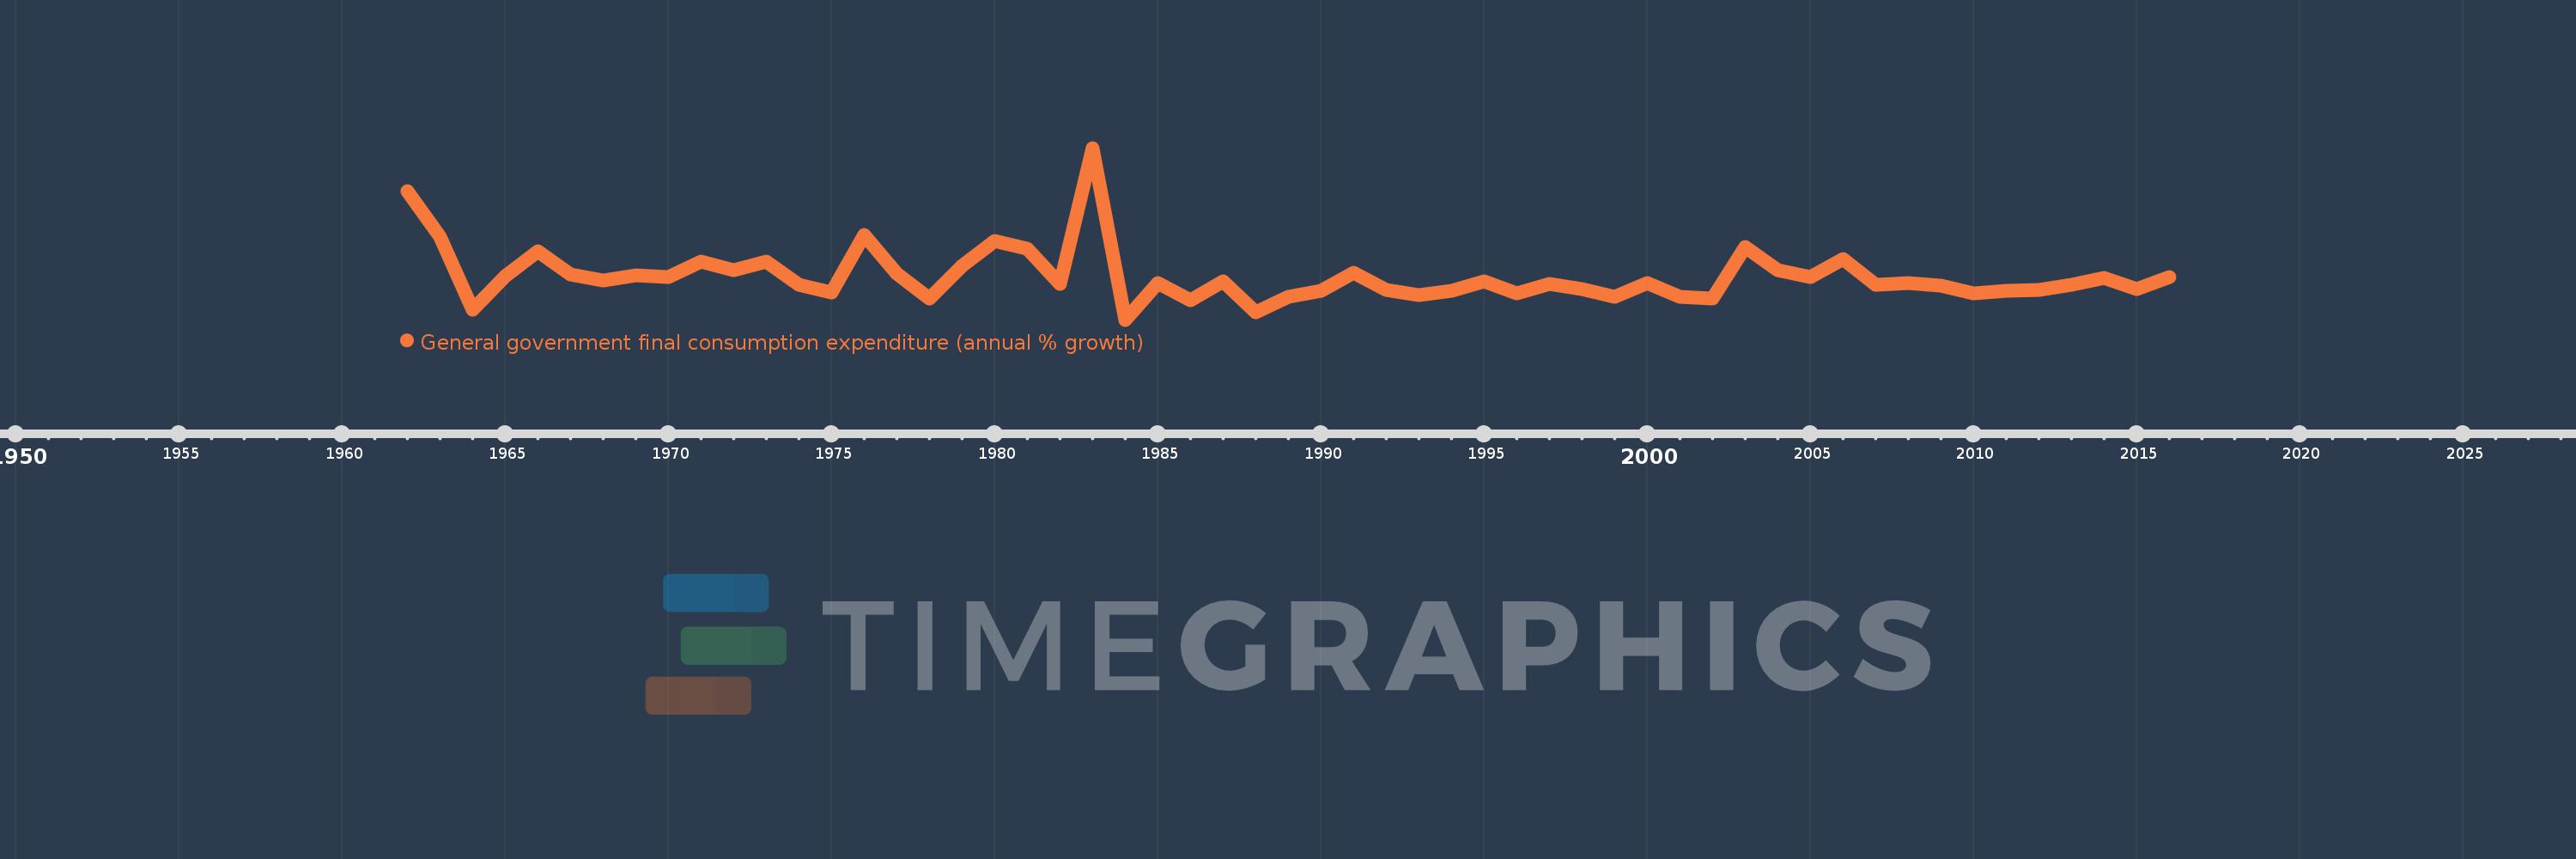
General government final consumption expenditure (annual % growth)
2016,2015,2014,2013,2012,2011,2010,2009,2008,2007,2006,2005,2004,2003,2002,2001,2000,1999,1998,1997,1996,1995,1994,1993,1992,1991,1990,1989,1988,1987,1986,1985,1984,1983,1982,1981,1980,1979,1978,1977,1976,1975,1974,1973,1972,1971,1970,1969,1968,1967,1966,1965,1964,1963,1962
This statistics in other country:
AlbaniaAlgeriaAntigua and BarbudaArab WorldArgentinaArmeniaAustraliaAustriaAzerbaijanBahamas, TheBahrainBangladeshBarbadosBelarusBelgiumBelizeBeninBhutanBoliviaBosnia and HerzegovinaBotswanaBrazilBrunei DarussalamBulgariaBurkina FasoBurundiCabo VerdeCambodiaCameroonCanadaCaribbean small statesCentral Europe and the BalticsChadChileChinaColombiaComorosCongo, Dem. Rep.Congo, Rep.Costa RicaCote d'IvoireCroatiaCubaCyprusCzech RepublicDenmarkDjiboutiDominican RepublicEarly-demographic dividendEast Asia & PacificEast Asia & Pacific (excluding high income)East Asia & Pacific (IDA & IBRD countries)EcuadorEgypt, Arab Rep.El SalvadorEquatorial GuineaEritreaEstoniaEthiopiaEuro areaEurope & Central AsiaEurope & Central Asia (excluding high income)Europe & Central Asia (IDA & IBRD countries)European UnionFijiFinlandFranceGabonGambia, TheGeorgiaGermanyGhanaGreeceGuatemalaGuineaGuinea-BissauHaitiHeavily indebted poor countries (HIPC)High incomeHondurasHong Kong SAR, ChinaHungaryIBRD onlyIcelandIDA & IBRD totalIDA blendIDA onlyIDA totalIndiaIndonesiaIran, Islamic Rep.IrelandIsraelItalyJamaicaJapanJordanKazakhstanKenyaKorea, Rep.KosovoKuwaitKyrgyz RepublicLao PDRLate-demographic dividendLatin America & Caribbean Latin America & Caribbean (excluding high income)Latin America & the Caribbean (IDA & IBRD countries)LatviaLebanonLiberiaLithuaniaLow & middle incomeLow incomeLower middle incomeLuxembourgMacao SAR, ChinaMacedonia, FYRMadagascarMalawiMalaysiaMaliMaltaMauritaniaMauritiusMexicoMiddle East & North AfricaMiddle East & North Africa (excluding high income)Middle East & North Africa (IDA & IBRD countries)Middle incomeMoldovaMongoliaMontenegroMoroccoMozambiqueNamibiaNepalNetherlandsNew ZealandNicaraguaNigerNigeriaNorth AmericaNorwayOECD membersOmanOther small statesPakistanPanamaPapua New GuineaParaguayPeruPhilippinesPolandPortugalPost-demographic dividendPuerto RicoQatarRomaniaRussian FederationRwandaSaudi ArabiaSenegalSerbiaSeychellesSierra LeoneSingaporeSlovak RepublicSloveniaSmall statesSomaliaSouth AfricaSouth AsiaSouth Asia (IDA & IBRD)South SudanSpainSri LankaSub-Saharan Africa Sub-Saharan Africa (excluding high income)Sub-Saharan Africa (IDA & IBRD countries)SudanSurinameSwazilandSwedenSwitzerlandSyrian Arab RepublicTajikistanTanzaniaThailandTimor-LesteTogoTrinidad and TobagoTunisiaTurkeyTurkmenistanUgandaUkraineUnited Arab EmiratesUnited KingdomUnited StatesUpper middle incomeUruguayVanuatuVenezuela, RBVietnamWest Bank and GazaWorldZimbabwe Timeline:
This timeline shows a graph from 1962 to 2016 of Trinidad and Tobago. No data until 1961. Number of actual observations by date: 55.
Source name:
World Development Indicators
Source organization:
World Bank national accounts data, and OECD National Accounts data files.
Categories, topics:
Economy & Growth
Last updated:
apr 23, 2017
Indicators value changes by year
Minimum:
-16.809
jan 1, 1984
Maximum:
75.875
jan 1, 1983
At the date of observation
Value
Absolute change
Change from previous value
jan 1, 1962
52.475
+52.475
0.0%
jan 1, 1963
27.927
-24.548
-46.78%
jan 1, 1964
-11.213
-39.139
-140.15%
jan 1, 1965
6.805
+18.018
-160.69%
jan 1, 1966
20.175
+13.37
196.46%
jan 1, 1967
7.605
-12.57
-62.3%
jan 1, 1968
4.328
-3.277
-43.08%
jan 1, 1969
7.322
+2.993
69.15%
jan 1, 1970
6.424
-0.897
-12.26%
jan 1, 1971
14.69
+8.266
128.67%
jan 1, 1972
9.735
-4.956
-33.73%
jan 1, 1973
14.474
+4.739
48.68%
jan 1, 1974
2.188
-12.286
-84.89%
jan 1, 1975
-2.322
-4.51
-206.15%
jan 1, 1976
28.789
+31.111
-1.34K%
jan 1, 1977
7.874
-20.915
-72.65%
jan 1, 1978
-5.16
-13.035
-165.54%
jan 1, 1979
12.151
+17.312
-335.47%
jan 1, 1980
25.54
+13.389
110.19%
jan 1, 1981
21.403
-4.137
-16.2%
jan 1, 1982
2.306
-19.097
-89.22%
jan 1, 1983
75.875
+73.569
3.19K%
jan 1, 1984
-16.809
-92.684
-122.15%
jan 1, 1985
3.041
+19.85
-118.09%
jan 1, 1986
-6.519
-9.56
-314.37%
jan 1, 1987
3.816
+10.335
-158.54%
jan 1, 1988
-13.002
-16.818
-440.67%
jan 1, 1989
-4.21
+8.792
-67.62%
jan 1, 1990
-1.022
+3.188
-75.73%
jan 1, 1991
8.373
+9.395
-919.48%
jan 1, 1992
-0.605
-8.978
-107.22%
jan 1, 1993
-3.605
-3.0
496.11%
jan 1, 1994
-1.042
+2.564
-71.11%
jan 1, 1995
4.003
+5.044
-484.31%
jan 1, 1996
-2.401
-6.404
-159.99%
jan 1, 1997
2.65
+5.051
-210.38%
jan 1, 1998
-0.153
-2.803
-105.77%
jan 1, 1999
-4.631
-4.477
2.93K%
jan 1, 2000
3.089
+7.72
-166.71%
jan 1, 2001
-4.267
-7.356
-238.14%
jan 1, 2002
-5.159
-0.892
20.91%
jan 1, 2003
22.568
+27.727
-537.44%
jan 1, 2004
10.097
-12.471
-55.26%
jan 1, 2005
6.0
-4.097
-40.58%
jan 1, 2006
16.011
+10.011
166.86%
jan 1, 2007
1.881
-14.13
-88.25%
jan 1, 2008
3.155
+1.274
67.74%
jan 1, 2009
1.453
-1.702
-53.95%
jan 1, 2010
-2.403
-3.855
-265.38%
jan 1, 2011
-0.979
+1.424
-59.26%
jan 1, 2012
-0.642
+0.337
-34.43%
jan 1, 2013
2.03
+2.672
-416.31%
jan 1, 2014
5.905
+3.875
190.87%
jan 1, 2015
-0.456
-6.361
-107.72%
jan 1, 2016
6.265
+6.721
-1.47K%
Ranking of countries by current statistics by years


Comments: