29
/
en
AIzaSyAYiBZKx7MnpbEhh9jyipgxe19OcubqV5w
April 1, 2024
73920
Austria
AUT
true
2
1
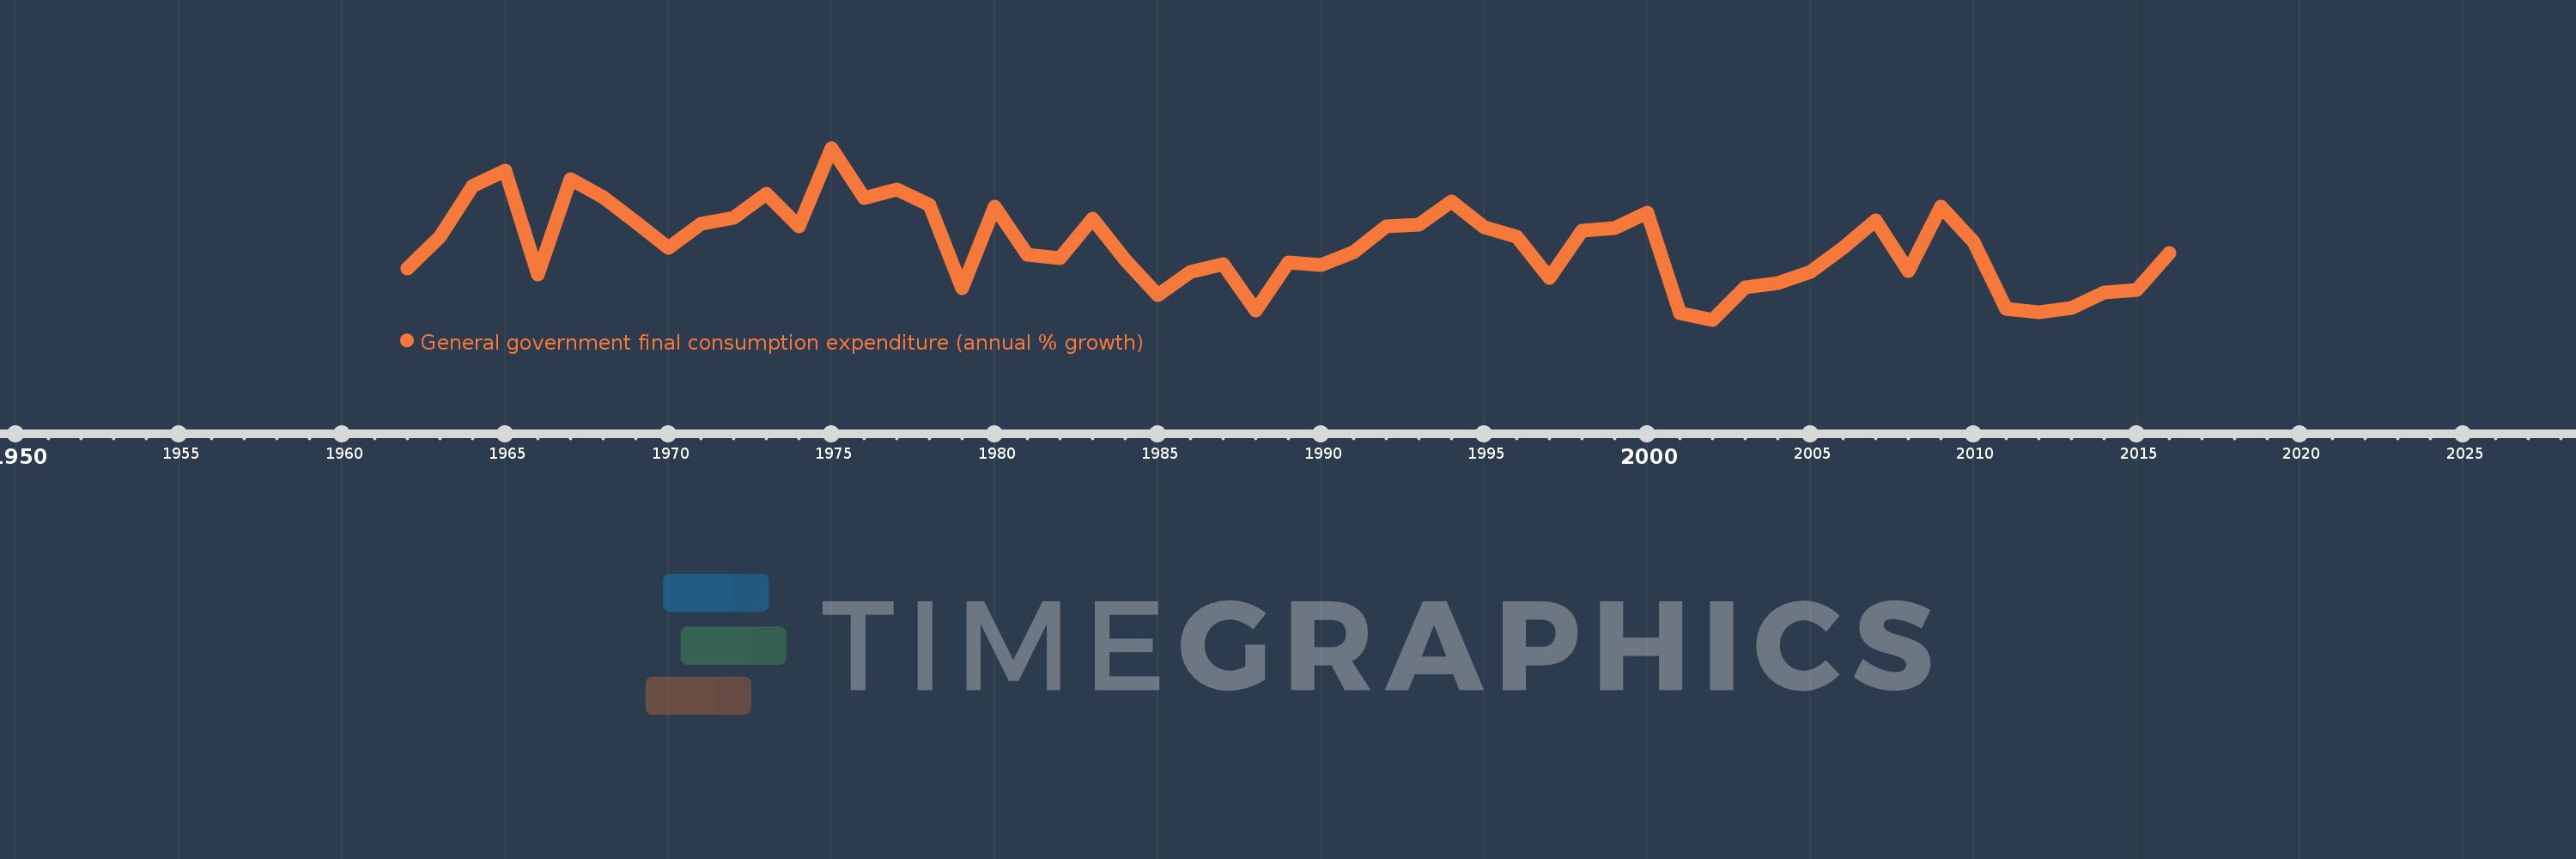
General government final consumption expenditure (annual % growth)
2016,2015,2014,2013,2012,2011,2010,2009,2008,2007,2006,2005,2004,2003,2002,2001,2000,1999,1998,1997,1996,1995,1994,1993,1992,1991,1990,1989,1988,1987,1986,1985,1984,1983,1982,1981,1980,1979,1978,1977,1976,1975,1974,1973,1972,1971,1970,1969,1968,1967,1966,1965,1964,1963,1962
This statistics in other country:
AlbaniaAlgeriaAntigua and BarbudaArab WorldArgentinaArmeniaAustraliaAustriaAzerbaijanBahamas, TheBahrainBangladeshBarbadosBelarusBelgiumBelizeBeninBhutanBoliviaBosnia and HerzegovinaBotswanaBrazilBrunei DarussalamBulgariaBurkina FasoBurundiCabo VerdeCambodiaCameroonCanadaCaribbean small statesCentral Europe and the BalticsChadChileChinaColombiaComorosCongo, Dem. Rep.Congo, Rep.Costa RicaCote d'IvoireCroatiaCubaCyprusCzech RepublicDenmarkDjiboutiDominican RepublicEarly-demographic dividendEast Asia & PacificEast Asia & Pacific (excluding high income)East Asia & Pacific (IDA & IBRD countries)EcuadorEgypt, Arab Rep.El SalvadorEquatorial GuineaEritreaEstoniaEthiopiaEuro areaEurope & Central AsiaEurope & Central Asia (excluding high income)Europe & Central Asia (IDA & IBRD countries)European UnionFijiFinlandFranceGabonGambia, TheGeorgiaGermanyGhanaGreeceGuatemalaGuineaGuinea-BissauHaitiHeavily indebted poor countries (HIPC)High incomeHondurasHong Kong SAR, ChinaHungaryIBRD onlyIcelandIDA & IBRD totalIDA blendIDA onlyIDA totalIndiaIndonesiaIran, Islamic Rep.IrelandIsraelItalyJamaicaJapanJordanKazakhstanKenyaKorea, Rep.KosovoKuwaitKyrgyz RepublicLao PDRLate-demographic dividendLatin America & Caribbean Latin America & Caribbean (excluding high income)Latin America & the Caribbean (IDA & IBRD countries)LatviaLebanonLiberiaLithuaniaLow & middle incomeLow incomeLower middle incomeLuxembourgMacao SAR, ChinaMacedonia, FYRMadagascarMalawiMalaysiaMaliMaltaMauritaniaMauritiusMexicoMiddle East & North AfricaMiddle East & North Africa (excluding high income)Middle East & North Africa (IDA & IBRD countries)Middle incomeMoldovaMongoliaMontenegroMoroccoMozambiqueNamibiaNepalNetherlandsNew ZealandNicaraguaNigerNigeriaNorth AmericaNorwayOECD membersOmanOther small statesPakistanPanamaPapua New GuineaParaguayPeruPhilippinesPolandPortugalPost-demographic dividendPuerto RicoQatarRomaniaRussian FederationRwandaSaudi ArabiaSenegalSerbiaSeychellesSierra LeoneSingaporeSlovak RepublicSloveniaSmall statesSomaliaSouth AfricaSouth AsiaSouth Asia (IDA & IBRD)South SudanSpainSri LankaSub-Saharan Africa Sub-Saharan Africa (excluding high income)Sub-Saharan Africa (IDA & IBRD countries)SudanSurinameSwazilandSwedenSwitzerlandSyrian Arab RepublicTajikistanTanzaniaThailandTimor-LesteTogoTrinidad and TobagoTunisiaTurkeyTurkmenistanUgandaUkraineUnited Arab EmiratesUnited KingdomUnited StatesUpper middle incomeUruguayVanuatuVenezuela, RBVietnamWest Bank and GazaWorldZimbabwe Timeline:
This timeline shows a graph from 1962 to 2016 of Austria. No data until 1961. Number of actual observations by date: 55.
Source name:
World Development Indicators
Source organization:
World Bank national accounts data, and OECD National Accounts data files.
Categories, topics:
Economy & Growth
Last updated:
apr 23, 2017
Indicators value changes by year
Minimum:
-0.239
jan 1, 2002
At the date of observation
Value
Absolute change
Change from previous value
jan 1, 1962
1.527
+1.527
0.0%
jan 1, 1963
2.632
+1.105
72.37%
jan 1, 1964
4.396
+1.764
67.03%
jan 1, 1965
4.912
+0.517
11.75%
jan 1, 1966
1.338
-3.574
-72.77%
jan 1, 1967
4.638
+3.3
246.66%
jan 1, 1968
3.993
-0.645
-13.9%
jan 1, 1969
3.144
-0.849
-21.26%
jan 1, 1970
2.256
-0.888
-28.23%
jan 1, 1971
3.089
+0.832
36.9%
jan 1, 1972
3.277
+0.188
6.09%
jan 1, 1973
4.115
+0.838
25.58%
jan 1, 1974
2.983
-1.132
-27.52%
jan 1, 1975
5.703
+2.72
91.2%
jan 1, 1976
3.979
-1.724
-30.24%
jan 1, 1977
4.259
+0.28
7.04%
jan 1, 1978
3.729
-0.53
-12.44%
jan 1, 1979
0.849
-2.88
-77.24%
jan 1, 1980
3.662
+2.813
331.46%
jan 1, 1981
2.001
-1.661
-45.36%
jan 1, 1982
1.89
-0.111
-5.54%
jan 1, 1983
3.244
+1.354
71.65%
jan 1, 1984
1.835
-1.409
-43.44%
jan 1, 1985
0.624
-1.21
-65.97%
jan 1, 1986
1.41
+0.786
125.79%
jan 1, 1987
1.688
+0.278
19.75%
jan 1, 1988
0.071
-1.617
-95.79%
jan 1, 1989
1.743
+1.672
2.35K%
jan 1, 1990
1.652
-0.091
-5.2%
jan 1, 1991
2.111
+0.459
27.77%
jan 1, 1992
3.004
+0.894
42.35%
jan 1, 1993
3.045
+0.04
1.34%
jan 1, 1994
3.839
+0.794
26.09%
jan 1, 1995
2.957
-0.882
-22.98%
jan 1, 1996
2.626
-0.331
-11.2%
jan 1, 1997
1.219
-1.407
-53.58%
jan 1, 1998
2.836
+1.617
132.64%
jan 1, 1999
2.918
+0.082
2.89%
jan 1, 2000
3.468
+0.55
18.86%
jan 1, 2001
-0.023
-3.491
-100.66%
jan 1, 2002
-0.239
-0.217
952.39%
jan 1, 2003
0.872
+1.111
-464.01%
jan 1, 2004
1.03
+0.158
18.13%
jan 1, 2005
1.42
+0.39
37.87%
jan 1, 2006
2.253
+0.833
58.67%
jan 1, 2007
3.209
+0.956
42.43%
jan 1, 2008
1.445
-1.764
-54.98%
jan 1, 2009
3.681
+2.236
154.79%
jan 1, 2010
2.464
-1.217
-33.06%
jan 1, 2011
0.131
-2.333
-94.67%
jan 1, 2012
0.016
-0.116
-88.11%
jan 1, 2013
0.155
+0.14
893.98%
jan 1, 2014
0.697
+0.541
348.69%
jan 1, 2015
0.797
+0.1
14.39%
jan 1, 2016
2.071
+1.274
159.85%
Ranking of countries by current statistics by years


Comments: