29
/
en
AIzaSyAYiBZKx7MnpbEhh9jyipgxe19OcubqV5w
April 1, 2024
226760
Puerto Rico
PRI
true
2
1
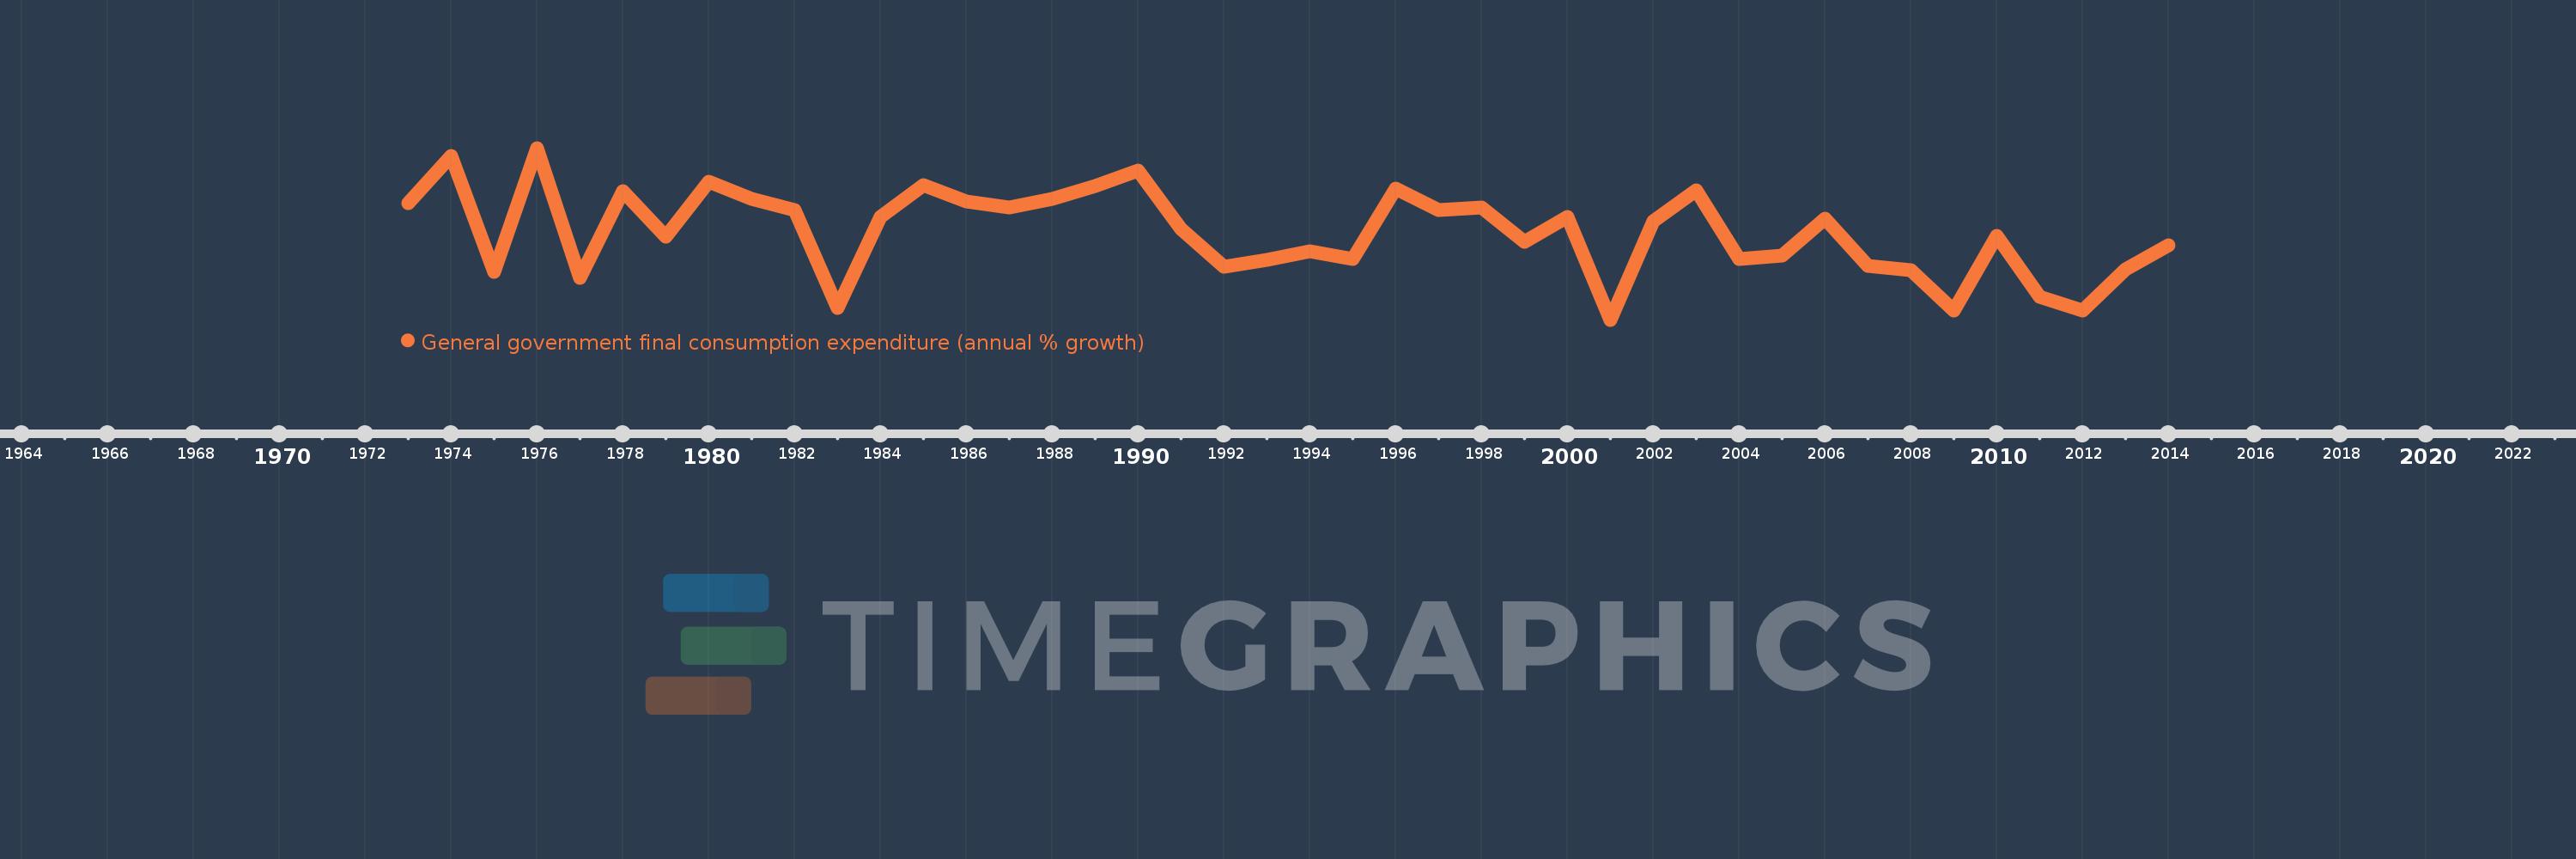
General government final consumption expenditure (annual % growth)
2014,2013,2012,2011,2010,2009,2008,2007,2006,2005,2004,2003,2002,2001,2000,1999,1998,1997,1996,1995,1994,1993,1992,1991,1990,1989,1988,1987,1986,1985,1984,1983,1982,1981,1980,1979,1978,1977,1976,1975,1974,1973
This statistics in other country:
AlbaniaAlgeriaAntigua and BarbudaArab WorldArgentinaArmeniaAustraliaAustriaAzerbaijanBahamas, TheBahrainBangladeshBarbadosBelarusBelgiumBelizeBeninBhutanBoliviaBosnia and HerzegovinaBotswanaBrazilBrunei DarussalamBulgariaBurkina FasoBurundiCabo VerdeCambodiaCameroonCanadaCaribbean small statesCentral Europe and the BalticsChadChileChinaColombiaComorosCongo, Dem. Rep.Congo, Rep.Costa RicaCote d'IvoireCroatiaCubaCyprusCzech RepublicDenmarkDjiboutiDominican RepublicEarly-demographic dividendEast Asia & PacificEast Asia & Pacific (excluding high income)East Asia & Pacific (IDA & IBRD countries)EcuadorEgypt, Arab Rep.El SalvadorEquatorial GuineaEritreaEstoniaEthiopiaEuro areaEurope & Central AsiaEurope & Central Asia (excluding high income)Europe & Central Asia (IDA & IBRD countries)European UnionFijiFinlandFranceGabonGambia, TheGeorgiaGermanyGhanaGreeceGuatemalaGuineaGuinea-BissauHaitiHeavily indebted poor countries (HIPC)High incomeHondurasHong Kong SAR, ChinaHungaryIBRD onlyIcelandIDA & IBRD totalIDA blendIDA onlyIDA totalIndiaIndonesiaIran, Islamic Rep.IrelandIsraelItalyJamaicaJapanJordanKazakhstanKenyaKorea, Rep.KosovoKuwaitKyrgyz RepublicLao PDRLate-demographic dividendLatin America & Caribbean Latin America & Caribbean (excluding high income)Latin America & the Caribbean (IDA & IBRD countries)LatviaLebanonLiberiaLithuaniaLow & middle incomeLow incomeLower middle incomeLuxembourgMacao SAR, ChinaMacedonia, FYRMadagascarMalawiMalaysiaMaliMaltaMauritaniaMauritiusMexicoMiddle East & North AfricaMiddle East & North Africa (excluding high income)Middle East & North Africa (IDA & IBRD countries)Middle incomeMoldovaMongoliaMontenegroMoroccoMozambiqueNamibiaNepalNetherlandsNew ZealandNicaraguaNigerNigeriaNorth AmericaNorwayOECD membersOmanOther small statesPakistanPanamaPapua New GuineaParaguayPeruPhilippinesPolandPortugalPost-demographic dividendPuerto RicoQatarRomaniaRussian FederationRwandaSaudi ArabiaSenegalSerbiaSeychellesSierra LeoneSingaporeSlovak RepublicSloveniaSmall statesSomaliaSouth AfricaSouth AsiaSouth Asia (IDA & IBRD)South SudanSpainSri LankaSub-Saharan Africa Sub-Saharan Africa (excluding high income)Sub-Saharan Africa (IDA & IBRD countries)SudanSurinameSwazilandSwedenSwitzerlandSyrian Arab RepublicTajikistanTanzaniaThailandTimor-LesteTogoTrinidad and TobagoTunisiaTurkeyTurkmenistanUgandaUkraineUnited Arab EmiratesUnited KingdomUnited StatesUpper middle incomeUruguayVanuatuVenezuela, RBVietnamWest Bank and GazaWorldZimbabwe Timeline:
This timeline shows a graph from 1973 to 2014 of Puerto Rico. No data until 1972. Number of actual observations by date: 42.
Source name:
World Development Indicators
Source organization:
World Bank national accounts data, and OECD National Accounts data files.
Categories, topics:
Economy & Growth
Last updated:
apr 23, 2017
Indicators value changes by year
Minimum:
-5.568
jan 1, 2001
Maximum:
10.918
jan 1, 1976
At the date of observation
Value
Absolute change
Change from previous value
jan 1, 1973
5.657
+5.657
0.0%
jan 1, 1974
10.19
+4.533
80.13%
jan 1, 1975
-0.94
-11.13
-109.23%
jan 1, 1976
10.918
+11.858
-1.26K%
jan 1, 1977
-1.569
-12.487
-114.37%
jan 1, 1978
6.812
+8.381
-534.08%
jan 1, 1979
2.442
-4.369
-64.14%
jan 1, 1980
7.682
+5.24
214.54%
jan 1, 1981
6.027
-1.655
-21.54%
jan 1, 1982
4.988
-1.039
-17.23%
jan 1, 1983
-4.42
-9.408
-188.6%
jan 1, 1984
4.277
+8.697
-196.78%
jan 1, 1985
7.317
+3.04
71.06%
jan 1, 1986
5.785
-1.532
-20.94%
jan 1, 1987
5.176
-0.609
-10.53%
jan 1, 1988
6.035
+0.86
16.61%
jan 1, 1989
7.268
+1.233
20.42%
jan 1, 1990
8.735
+1.467
20.18%
jan 1, 1991
3.153
-5.582
-63.9%
jan 1, 1992
-0.509
-3.663
-116.16%
jan 1, 1993
0.146
+0.656
-128.72%
jan 1, 1994
1.023
+0.876
598.98%
jan 1, 1995
0.289
-0.733
-71.72%
jan 1, 1996
6.994
+6.704
2.32K%
jan 1, 1997
4.987
-2.007
-28.7%
jan 1, 1998
5.199
+0.212
4.26%
jan 1, 1999
1.891
-3.308
-63.62%
jan 1, 2000
4.311
+2.42
127.95%
jan 1, 2001
-5.568
-9.88
-229.15%
jan 1, 2002
3.891
+9.459
-169.87%
jan 1, 2003
6.869
+2.979
76.57%
jan 1, 2004
0.26
-6.61
-96.22%
jan 1, 2005
0.568
+0.308
118.67%
jan 1, 2006
4.095
+3.527
620.67%
jan 1, 2007
-0.419
-4.514
-110.23%
jan 1, 2008
-0.836
-0.417
99.6%
jan 1, 2009
-4.69
-3.855
461.21%
jan 1, 2010
2.516
+7.206
-153.63%
jan 1, 2011
-3.359
-5.875
-233.54%
jan 1, 2012
-4.707
-1.348
40.11%
jan 1, 2013
-0.716
+3.991
-84.8%
jan 1, 2014
1.592
+2.308
-322.5%
Ranking of countries by current statistics by years


Comments: