29
/
en
AIzaSyAYiBZKx7MnpbEhh9jyipgxe19OcubqV5w
April 1, 2024
202930
Mozambique
MOZ
true
2
1
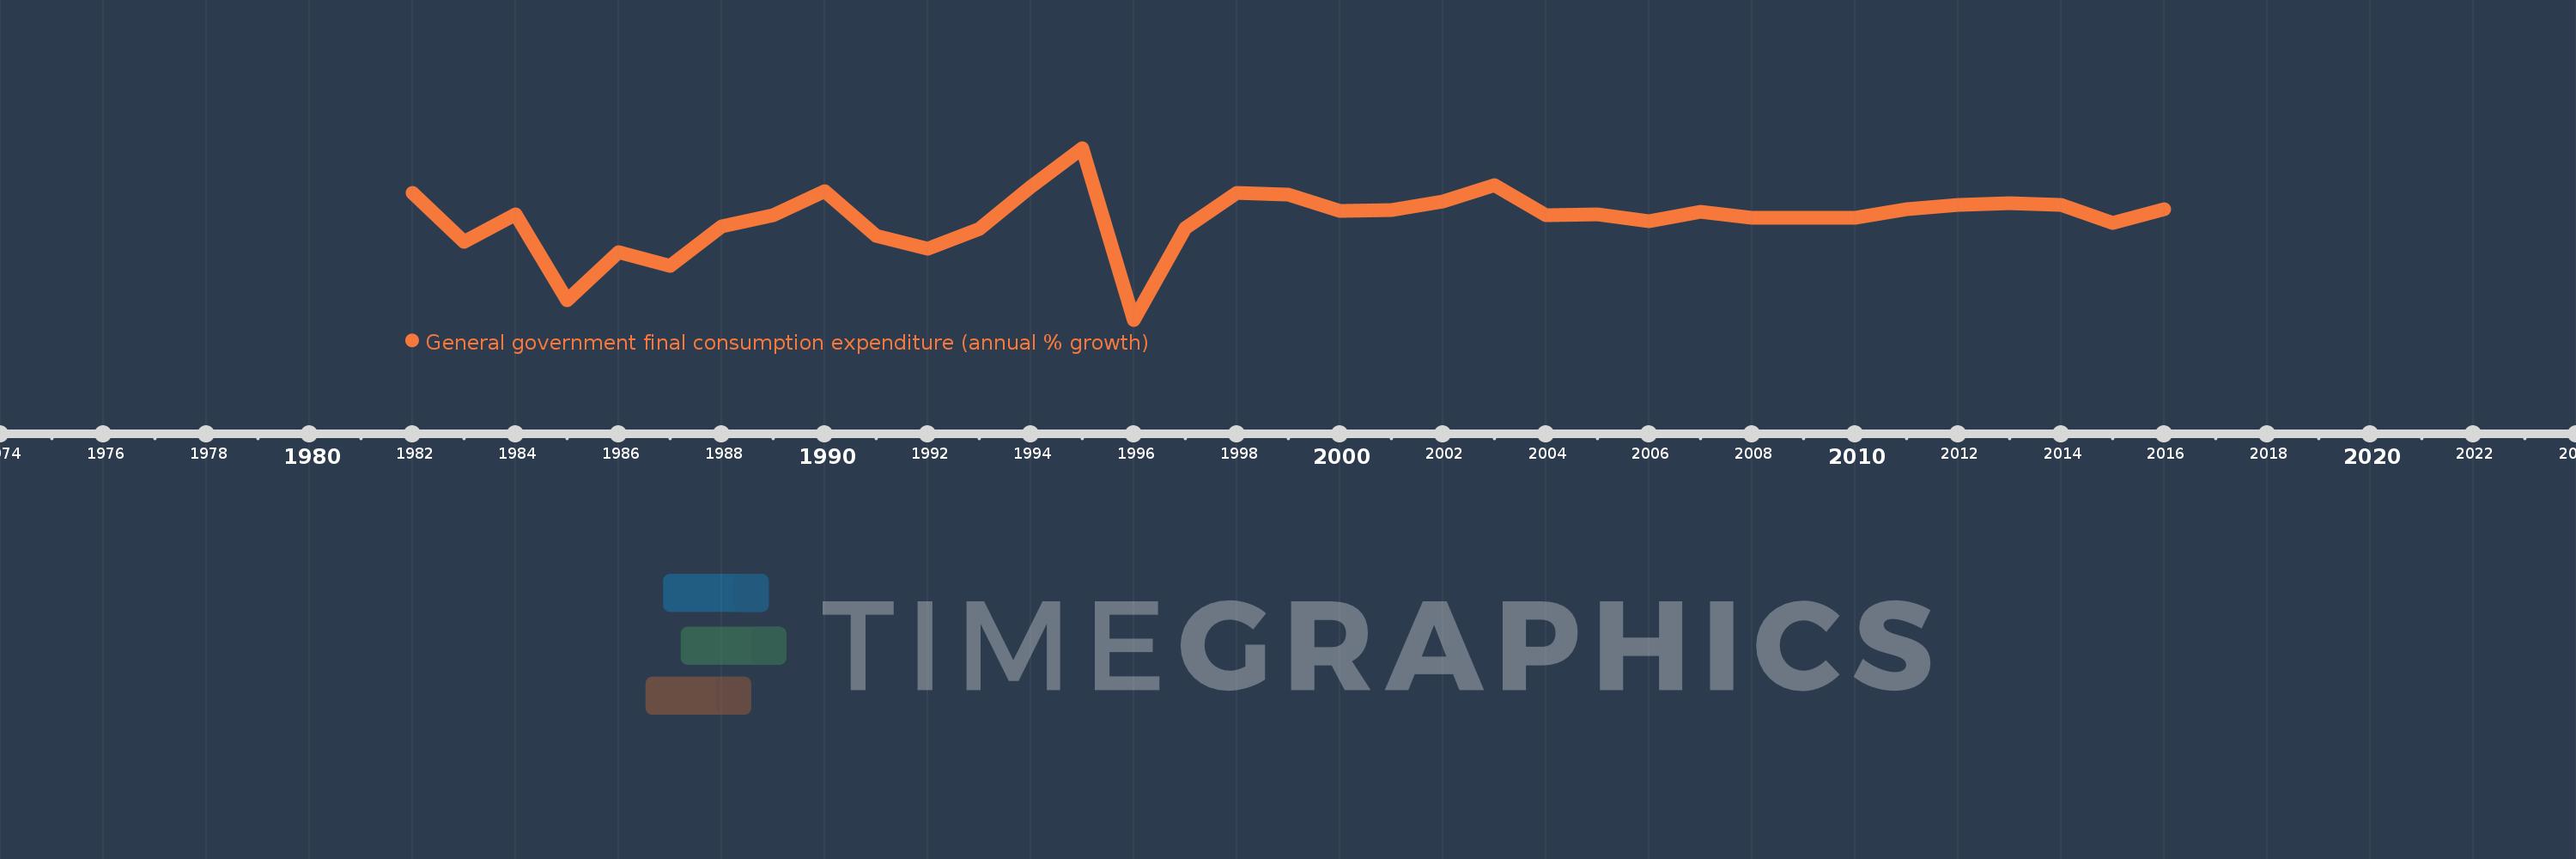
General government final consumption expenditure (annual % growth)
2016,2015,2014,2013,2012,2011,2010,2009,2008,2007,2006,2005,2004,2003,2002,2001,2000,1999,1998,1997,1996,1995,1994,1993,1992,1991,1990,1989,1988,1987,1986,1985,1984,1983,1982
This statistics in other country:
AlbaniaAlgeriaAntigua and BarbudaArab WorldArgentinaArmeniaAustraliaAustriaAzerbaijanBahamas, TheBahrainBangladeshBarbadosBelarusBelgiumBelizeBeninBhutanBoliviaBosnia and HerzegovinaBotswanaBrazilBrunei DarussalamBulgariaBurkina FasoBurundiCabo VerdeCambodiaCameroonCanadaCaribbean small statesCentral Europe and the BalticsChadChileChinaColombiaComorosCongo, Dem. Rep.Congo, Rep.Costa RicaCote d'IvoireCroatiaCubaCyprusCzech RepublicDenmarkDjiboutiDominican RepublicEarly-demographic dividendEast Asia & PacificEast Asia & Pacific (excluding high income)East Asia & Pacific (IDA & IBRD countries)EcuadorEgypt, Arab Rep.El SalvadorEquatorial GuineaEritreaEstoniaEthiopiaEuro areaEurope & Central AsiaEurope & Central Asia (excluding high income)Europe & Central Asia (IDA & IBRD countries)European UnionFijiFinlandFranceGabonGambia, TheGeorgiaGermanyGhanaGreeceGuatemalaGuineaGuinea-BissauHaitiHeavily indebted poor countries (HIPC)High incomeHondurasHong Kong SAR, ChinaHungaryIBRD onlyIcelandIDA & IBRD totalIDA blendIDA onlyIDA totalIndiaIndonesiaIran, Islamic Rep.IrelandIsraelItalyJamaicaJapanJordanKazakhstanKenyaKorea, Rep.KosovoKuwaitKyrgyz RepublicLao PDRLate-demographic dividendLatin America & Caribbean Latin America & Caribbean (excluding high income)Latin America & the Caribbean (IDA & IBRD countries)LatviaLebanonLiberiaLithuaniaLow & middle incomeLow incomeLower middle incomeLuxembourgMacao SAR, ChinaMacedonia, FYRMadagascarMalawiMalaysiaMaliMaltaMauritaniaMauritiusMexicoMiddle East & North AfricaMiddle East & North Africa (excluding high income)Middle East & North Africa (IDA & IBRD countries)Middle incomeMoldovaMongoliaMontenegroMoroccoMozambiqueNamibiaNepalNetherlandsNew ZealandNicaraguaNigerNigeriaNorth AmericaNorwayOECD membersOmanOther small statesPakistanPanamaPapua New GuineaParaguayPeruPhilippinesPolandPortugalPost-demographic dividendPuerto RicoQatarRomaniaRussian FederationRwandaSaudi ArabiaSenegalSerbiaSeychellesSierra LeoneSingaporeSlovak RepublicSloveniaSmall statesSomaliaSouth AfricaSouth AsiaSouth Asia (IDA & IBRD)South SudanSpainSri LankaSub-Saharan Africa Sub-Saharan Africa (excluding high income)Sub-Saharan Africa (IDA & IBRD countries)SudanSurinameSwazilandSwedenSwitzerlandSyrian Arab RepublicTajikistanTanzaniaThailandTimor-LesteTogoTrinidad and TobagoTunisiaTurkeyTurkmenistanUgandaUkraineUnited Arab EmiratesUnited KingdomUnited StatesUpper middle incomeUruguayVanuatuVenezuela, RBVietnamWest Bank and GazaWorldZimbabwe Timeline:
This timeline shows a graph from 1982 to 2016 of Mozambique. No data until 1981. Number of actual observations by date: 35.
Source name:
World Development Indicators
Source organization:
World Bank national accounts data, and OECD National Accounts data files.
Categories, topics:
Economy & Growth
Last updated:
apr 23, 2017
Indicators value changes by year
Minimum:
-49.43
jan 1, 1996
Maximum:
45.821
jan 1, 1995
At the date of observation
Value
Absolute change
Change from previous value
jan 1, 1982
21.07
+21.07
0.0%
jan 1, 1983
-6.273
-27.343
-129.77%
jan 1, 1984
9.076
+15.349
-244.68%
jan 1, 1985
-38.506
-47.583
-524.26%
jan 1, 1986
-12.003
+26.504
-68.83%
jan 1, 1987
-19.745
-7.742
64.5%
jan 1, 1988
2.31
+22.055
-111.7%
jan 1, 1989
8.569
+6.259
270.91%
jan 1, 1990
21.762
+13.193
153.96%
jan 1, 1991
-2.695
-24.457
-112.39%
jan 1, 1992
-9.997
-7.302
270.89%
jan 1, 1993
0.931
+10.927
-109.31%
jan 1, 1994
24.052
+23.122
2.48K%
jan 1, 1995
45.821
+21.769
90.51%
jan 1, 1996
-49.43
-95.252
-207.88%
jan 1, 1997
1.554
+50.984
-103.14%
jan 1, 1998
20.994
+19.44
1.25K%
jan 1, 1999
20.0
-0.994
-4.73%
jan 1, 2000
10.839
-9.162
-45.81%
jan 1, 2001
11.21
+0.372
3.43%
jan 1, 2002
16.331
+5.121
45.68%
jan 1, 2003
25.367
+9.035
55.32%
jan 1, 2004
8.715
-16.651
-65.64%
jan 1, 2005
9.138
+0.423
4.85%
jan 1, 2006
5.334
-3.805
-41.63%
jan 1, 2007
10.231
+4.897
91.82%
jan 1, 2008
7.206
-3.024
-29.56%
jan 1, 2009
7.286
+0.08
1.11%
jan 1, 2010
7.114
-0.172
-2.36%
jan 1, 2011
11.915
+4.801
67.48%
jan 1, 2012
14.255
+2.34
19.64%
jan 1, 2013
15.345
+1.09
7.65%
jan 1, 2014
14.44
-0.905
-5.9%
jan 1, 2015
4.158
-10.282
-71.2%
jan 1, 2016
11.844
+7.685
184.81%
Ranking of countries by current statistics by years


Comments: