29
/
en
AIzaSyAYiBZKx7MnpbEhh9jyipgxe19OcubqV5w
April 1, 2024
36579
IBRD only
IBD
false
2
1
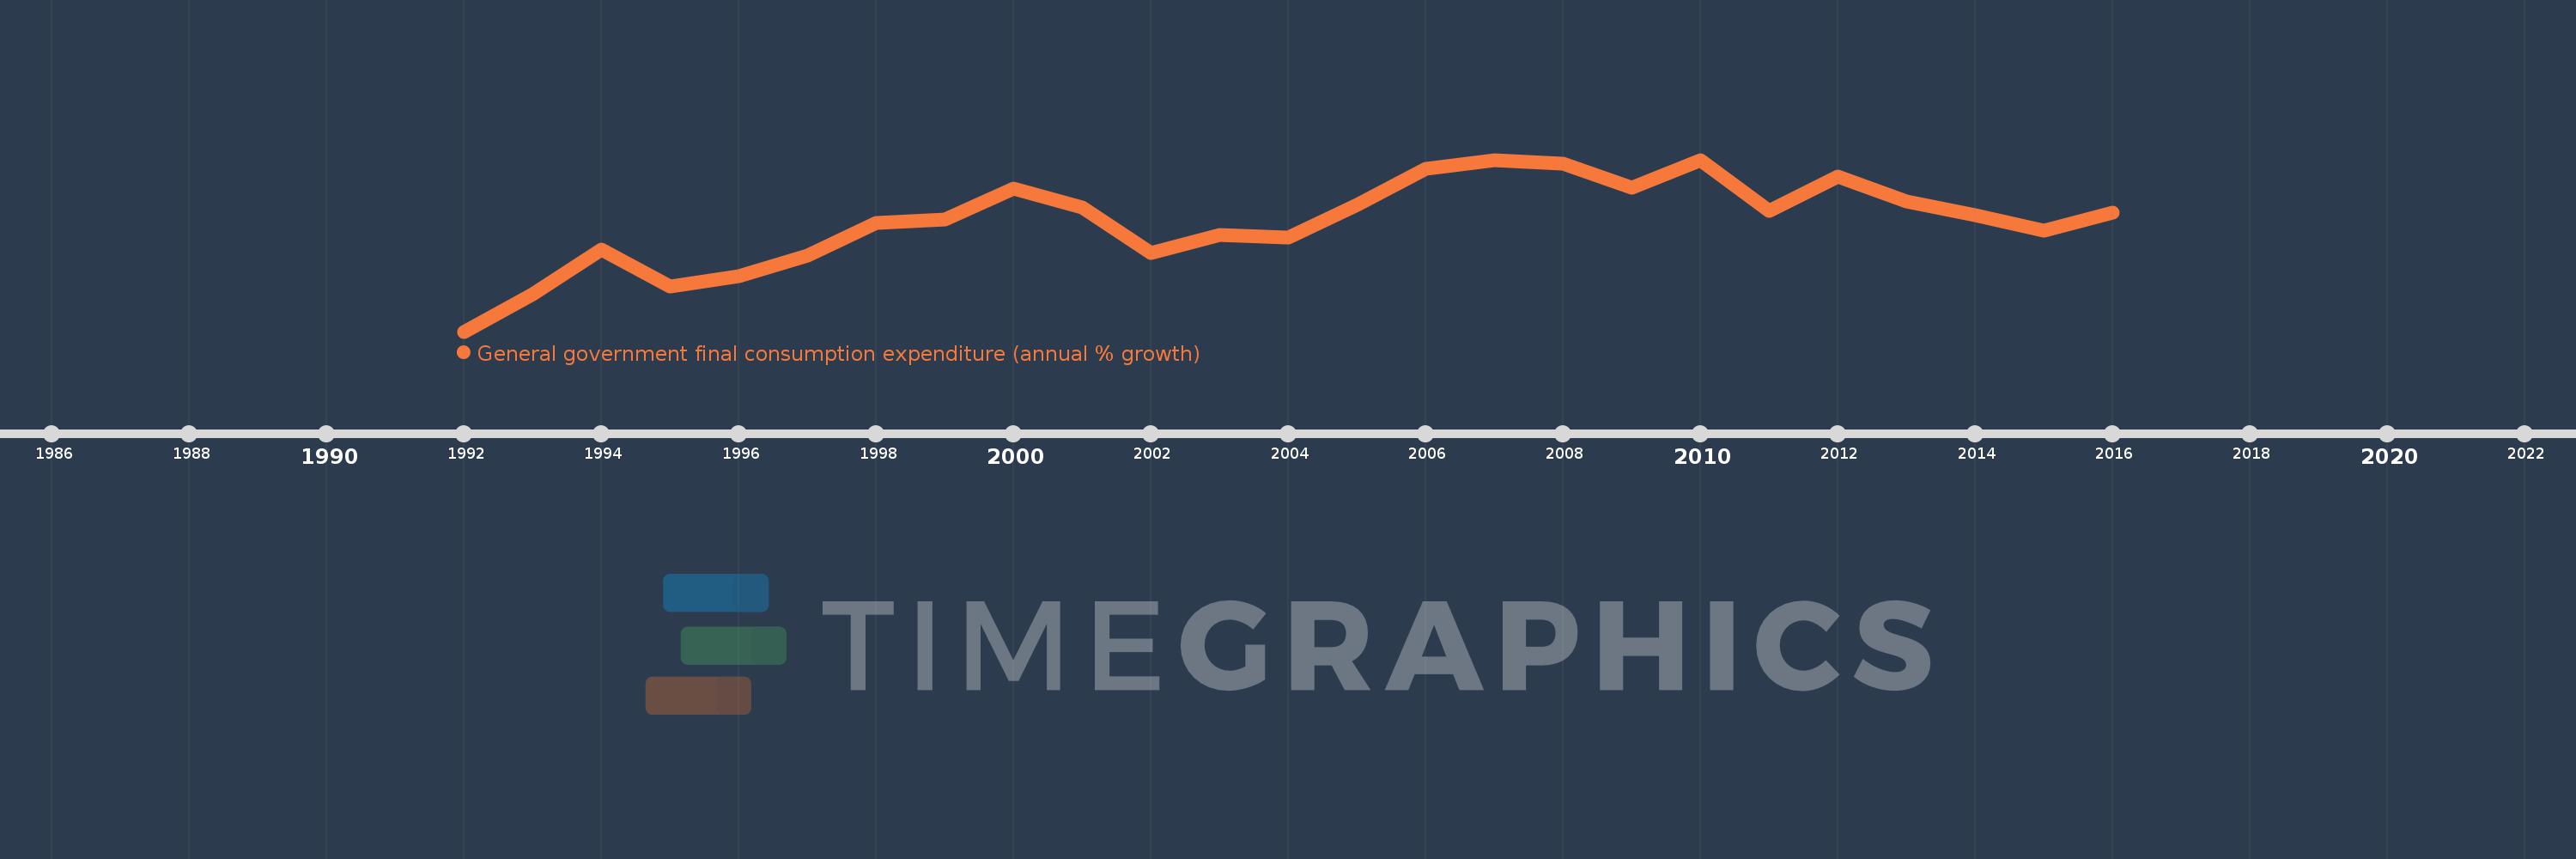
General government final consumption expenditure (annual % growth)
2016,2015,2014,2013,2012,2011,2010,2009,2008,2007,2006,2005,2004,2003,2002,2001,2000,1999,1998,1997,1996,1995,1994,1993,1992
This statistics in other country:
AlbaniaAlgeriaAntigua and BarbudaArab WorldArgentinaArmeniaAustraliaAustriaAzerbaijanBahamas, TheBahrainBangladeshBarbadosBelarusBelgiumBelizeBeninBhutanBoliviaBosnia and HerzegovinaBotswanaBrazilBrunei DarussalamBulgariaBurkina FasoBurundiCabo VerdeCambodiaCameroonCanadaCaribbean small statesCentral Europe and the BalticsChadChileChinaColombiaComorosCongo, Dem. Rep.Congo, Rep.Costa RicaCote d'IvoireCroatiaCubaCyprusCzech RepublicDenmarkDjiboutiDominican RepublicEarly-demographic dividendEast Asia & PacificEast Asia & Pacific (excluding high income)East Asia & Pacific (IDA & IBRD countries)EcuadorEgypt, Arab Rep.El SalvadorEquatorial GuineaEritreaEstoniaEthiopiaEuro areaEurope & Central AsiaEurope & Central Asia (excluding high income)Europe & Central Asia (IDA & IBRD countries)European UnionFijiFinlandFranceGabonGambia, TheGeorgiaGermanyGhanaGreeceGuatemalaGuineaGuinea-BissauHaitiHeavily indebted poor countries (HIPC)High incomeHondurasHong Kong SAR, ChinaHungaryIBRD onlyIcelandIDA & IBRD totalIDA blendIDA onlyIDA totalIndiaIndonesiaIran, Islamic Rep.IrelandIsraelItalyJamaicaJapanJordanKazakhstanKenyaKorea, Rep.KosovoKuwaitKyrgyz RepublicLao PDRLate-demographic dividendLatin America & Caribbean Latin America & Caribbean (excluding high income)Latin America & the Caribbean (IDA & IBRD countries)LatviaLebanonLiberiaLithuaniaLow & middle incomeLow incomeLower middle incomeLuxembourgMacao SAR, ChinaMacedonia, FYRMadagascarMalawiMalaysiaMaliMaltaMauritaniaMauritiusMexicoMiddle East & North AfricaMiddle East & North Africa (excluding high income)Middle East & North Africa (IDA & IBRD countries)Middle incomeMoldovaMongoliaMontenegroMoroccoMozambiqueNamibiaNepalNetherlandsNew ZealandNicaraguaNigerNigeriaNorth AmericaNorwayOECD membersOmanOther small statesPakistanPanamaPapua New GuineaParaguayPeruPhilippinesPolandPortugalPost-demographic dividendPuerto RicoQatarRomaniaRussian FederationRwandaSaudi ArabiaSenegalSerbiaSeychellesSierra LeoneSingaporeSlovak RepublicSloveniaSmall statesSomaliaSouth AfricaSouth AsiaSouth Asia (IDA & IBRD)South SudanSpainSri LankaSub-Saharan Africa Sub-Saharan Africa (excluding high income)Sub-Saharan Africa (IDA & IBRD countries)SudanSurinameSwazilandSwedenSwitzerlandSyrian Arab RepublicTajikistanTanzaniaThailandTimor-LesteTogoTrinidad and TobagoTunisiaTurkeyTurkmenistanUgandaUkraineUnited Arab EmiratesUnited KingdomUnited StatesUpper middle incomeUruguayVanuatuVenezuela, RBVietnamWest Bank and GazaWorldZimbabwe Timeline:
This timeline shows a graph from 1992 to 2016 of IBRD only. No data until 1991. Number of actual observations by date: 25.
Source name:
World Development Indicators
Source organization:
World Bank national accounts data, and OECD National Accounts data files.
Categories, topics:
Economy & Growth
Last updated:
apr 23, 2017
Indicators value changes by year
Minimum:
-0.904
jan 1, 1992
At the date of observation
Value
Absolute change
Change from previous value
jan 1, 1992
-0.904
-0.904
0.0%
jan 1, 1993
0.713
+1.617
-178.91%
jan 1, 1994
2.702
+1.989
278.82%
jan 1, 1995
1.06
-1.642
-60.78%
jan 1, 1996
1.503
+0.443
41.82%
jan 1, 1997
2.413
+0.91
60.59%
jan 1, 1998
3.854
+1.441
59.71%
jan 1, 1999
3.999
+0.145
3.75%
jan 1, 2000
5.371
+1.372
34.32%
jan 1, 2001
4.534
-0.836
-15.57%
jan 1, 2002
2.537
-1.997
-44.04%
jan 1, 2003
3.314
+0.777
30.62%
jan 1, 2004
3.194
-0.12
-3.62%
jan 1, 2005
4.632
+1.438
45.01%
jan 1, 2006
6.201
+1.569
33.86%
jan 1, 2007
6.58
+0.379
6.11%
jan 1, 2008
6.449
-0.131
-1.99%
jan 1, 2009
5.387
-1.062
-16.47%
jan 1, 2010
6.612
+1.225
22.75%
jan 1, 2011
4.388
-2.224
-33.64%
jan 1, 2012
5.884
+1.497
34.11%
jan 1, 2013
4.782
-1.102
-18.73%
jan 1, 2014
4.196
-0.586
-12.25%
jan 1, 2015
3.515
-0.681
-16.22%
jan 1, 2016
4.301
+0.785
22.34%
Ranking of countries by current statistics by years


Comments: