29
/
en
AIzaSyAYiBZKx7MnpbEhh9jyipgxe19OcubqV5w
April 1, 2024
276654
United States
USA
true
2
1
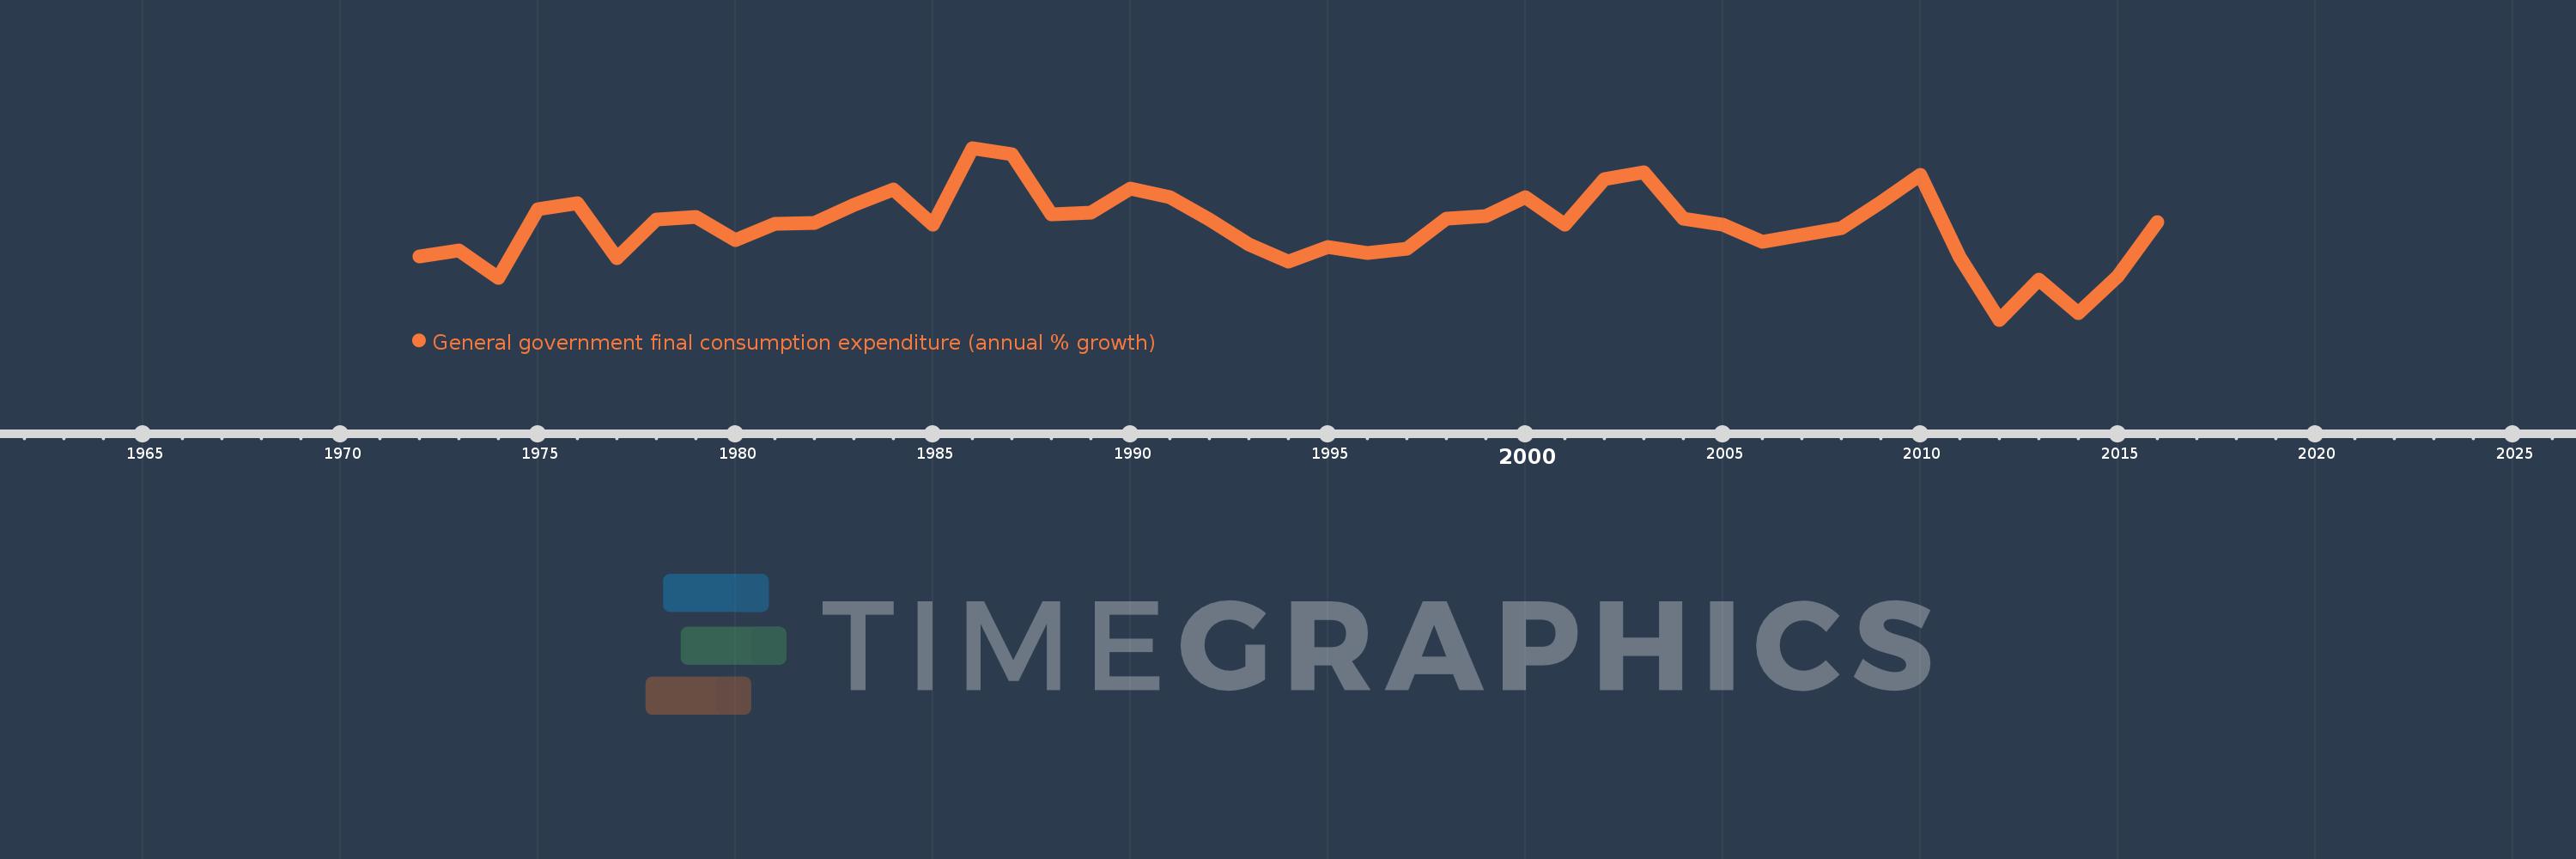
General government final consumption expenditure (annual % growth)
2016,2015,2014,2013,2012,2011,2010,2009,2008,2007,2006,2005,2004,2003,2002,2001,2000,1999,1998,1997,1996,1995,1994,1993,1992,1991,1990,1989,1988,1987,1986,1985,1984,1983,1982,1981,1980,1979,1978,1977,1976,1975,1974,1973,1972
This statistics in other country:
AlbaniaAlgeriaAntigua and BarbudaArab WorldArgentinaArmeniaAustraliaAustriaAzerbaijanBahamas, TheBahrainBangladeshBarbadosBelarusBelgiumBelizeBeninBhutanBoliviaBosnia and HerzegovinaBotswanaBrazilBrunei DarussalamBulgariaBurkina FasoBurundiCabo VerdeCambodiaCameroonCanadaCaribbean small statesCentral Europe and the BalticsChadChileChinaColombiaComorosCongo, Dem. Rep.Congo, Rep.Costa RicaCote d'IvoireCroatiaCubaCyprusCzech RepublicDenmarkDjiboutiDominican RepublicEarly-demographic dividendEast Asia & PacificEast Asia & Pacific (excluding high income)East Asia & Pacific (IDA & IBRD countries)EcuadorEgypt, Arab Rep.El SalvadorEquatorial GuineaEritreaEstoniaEthiopiaEuro areaEurope & Central AsiaEurope & Central Asia (excluding high income)Europe & Central Asia (IDA & IBRD countries)European UnionFijiFinlandFranceGabonGambia, TheGeorgiaGermanyGhanaGreeceGuatemalaGuineaGuinea-BissauHaitiHeavily indebted poor countries (HIPC)High incomeHondurasHong Kong SAR, ChinaHungaryIBRD onlyIcelandIDA & IBRD totalIDA blendIDA onlyIDA totalIndiaIndonesiaIran, Islamic Rep.IrelandIsraelItalyJamaicaJapanJordanKazakhstanKenyaKorea, Rep.KosovoKuwaitKyrgyz RepublicLao PDRLate-demographic dividendLatin America & Caribbean Latin America & Caribbean (excluding high income)Latin America & the Caribbean (IDA & IBRD countries)LatviaLebanonLiberiaLithuaniaLow & middle incomeLow incomeLower middle incomeLuxembourgMacao SAR, ChinaMacedonia, FYRMadagascarMalawiMalaysiaMaliMaltaMauritaniaMauritiusMexicoMiddle East & North AfricaMiddle East & North Africa (excluding high income)Middle East & North Africa (IDA & IBRD countries)Middle incomeMoldovaMongoliaMontenegroMoroccoMozambiqueNamibiaNepalNetherlandsNew ZealandNicaraguaNigerNigeriaNorth AmericaNorwayOECD membersOmanOther small statesPakistanPanamaPapua New GuineaParaguayPeruPhilippinesPolandPortugalPost-demographic dividendPuerto RicoQatarRomaniaRussian FederationRwandaSaudi ArabiaSenegalSerbiaSeychellesSierra LeoneSingaporeSlovak RepublicSloveniaSmall statesSomaliaSouth AfricaSouth AsiaSouth Asia (IDA & IBRD)South SudanSpainSri LankaSub-Saharan Africa Sub-Saharan Africa (excluding high income)Sub-Saharan Africa (IDA & IBRD countries)SudanSurinameSwazilandSwedenSwitzerlandSyrian Arab RepublicTajikistanTanzaniaThailandTimor-LesteTogoTrinidad and TobagoTunisiaTurkeyTurkmenistanUgandaUkraineUnited Arab EmiratesUnited KingdomUnited StatesUpper middle incomeUruguayVanuatuVenezuela, RBVietnamWest Bank and GazaWorldZimbabwe Timeline:
This timeline shows a graph from 1972 to 2016 of United States. No data until 1971. Number of actual observations by date: 45.
Source name:
World Development Indicators
Source organization:
World Bank national accounts data, and OECD National Accounts data files.
Categories, topics:
Economy & Growth
Last updated:
apr 23, 2017
Indicators value changes by year
Minimum:
-2.654
jan 1, 2012
At the date of observation
Value
Absolute change
Change from previous value
jan 1, 1972
0.125
+0.125
0.0%
jan 1, 1973
0.395
+0.27
215.53%
jan 1, 1974
-0.815
-1.21
-306.22%
jan 1, 1975
2.213
+3.028
-371.7%
jan 1, 1976
2.509
+0.296
13.37%
jan 1, 1977
0.075
-2.434
-97.0%
jan 1, 1978
1.781
+1.706
2.27K%
jan 1, 1979
1.867
+0.086
4.81%
jan 1, 1980
0.851
-1.016
-54.4%
jan 1, 1981
1.583
+0.732
85.98%
jan 1, 1982
1.628
+0.044
2.79%
jan 1, 1983
2.4
+0.773
47.47%
jan 1, 1984
3.078
+0.678
28.24%
jan 1, 1985
1.54
-1.538
-49.97%
jan 1, 1986
4.928
+3.388
220.02%
jan 1, 1987
4.66
-0.267
-5.42%
jan 1, 1988
1.993
-2.667
-57.23%
jan 1, 1989
2.061
+0.068
3.41%
jan 1, 1990
3.121
+1.06
51.42%
jan 1, 1991
2.756
-0.365
-11.7%
jan 1, 1992
1.787
-0.969
-35.17%
jan 1, 1993
0.678
-1.109
-62.07%
jan 1, 1994
-0.085
-0.763
-112.59%
jan 1, 1995
0.553
+0.638
-747.68%
jan 1, 1996
0.297
-0.255
-46.17%
jan 1, 1997
0.476
+0.178
59.98%
jan 1, 1998
1.826
+1.35
283.67%
jan 1, 1999
1.904
+0.079
4.3%
jan 1, 2000
2.745
+0.841
44.14%
jan 1, 2001
1.538
-1.207
-43.96%
jan 1, 2002
3.538
+2.0
130.0%
jan 1, 2003
3.868
+0.33
9.31%
jan 1, 2004
1.799
-2.069
-53.49%
jan 1, 2005
1.548
-0.251
-13.96%
jan 1, 2006
0.8
-0.748
-48.32%
jan 1, 2007
1.101
+0.301
37.66%
jan 1, 2008
1.396
+0.295
26.77%
jan 1, 2009
2.533
+1.137
81.45%
jan 1, 2010
3.746
+1.213
47.89%
jan 1, 2011
0.115
-3.631
-96.94%
jan 1, 2012
-2.654
-2.768
-2.41K%
jan 1, 2013
-0.879
+1.775
-66.87%
jan 1, 2014
-2.365
-1.486
169.09%
jan 1, 2015
-0.723
+1.643
-69.45%
jan 1, 2016
1.641
+2.364
-327.03%
Ranking of countries by current statistics by years


Comments: