29
/
en
AIzaSyAYiBZKx7MnpbEhh9jyipgxe19OcubqV5w
April 1, 2024
193035
Mauritania
MRT
true
2
1
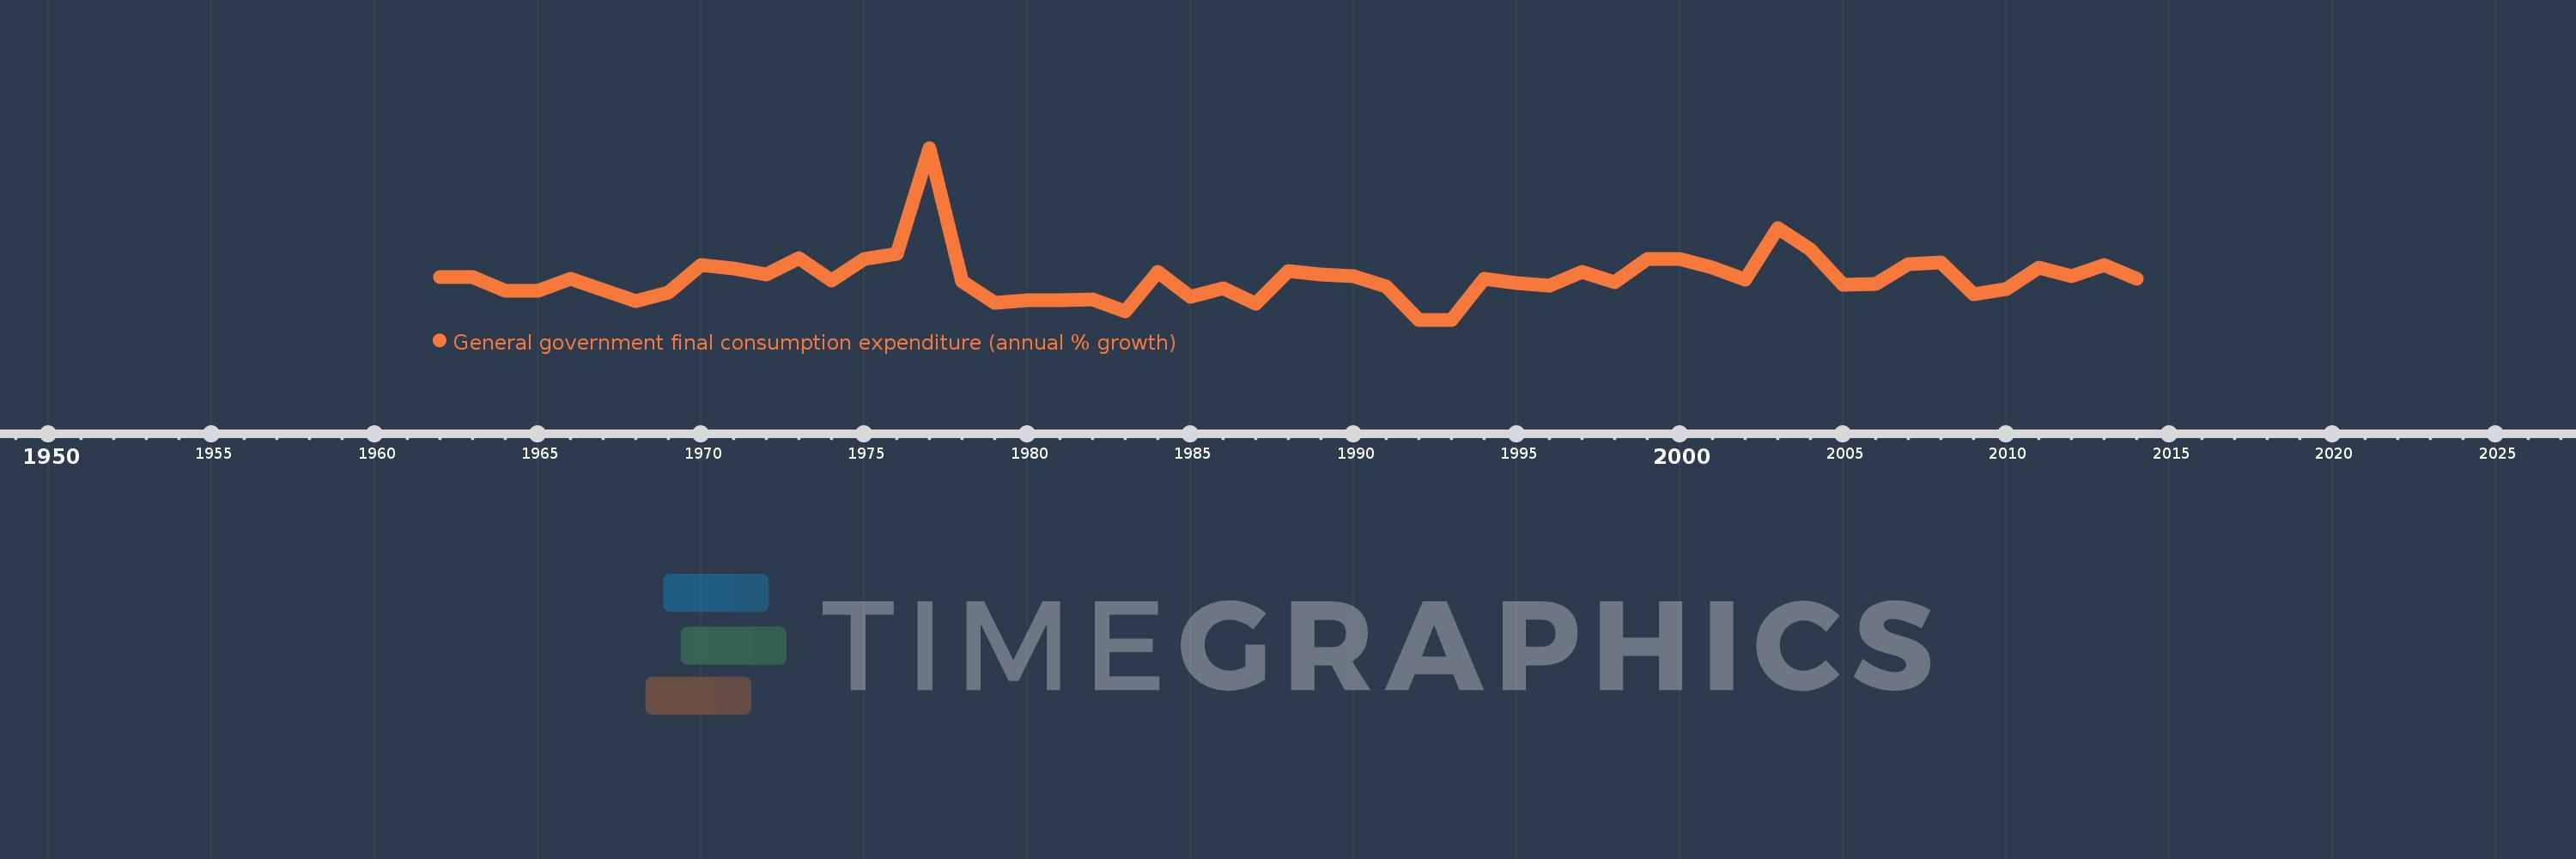
General government final consumption expenditure (annual % growth)
2014,2013,2012,2011,2010,2009,2008,2007,2006,2005,2004,2003,2002,2001,2000,1999,1998,1997,1996,1995,1994,1993,1992,1991,1990,1989,1988,1987,1986,1985,1984,1983,1982,1981,1980,1979,1978,1977,1976,1975,1974,1973,1972,1971,1970,1969,1968,1967,1966,1965,1964,1963,1962
This statistics in other country:
AlbaniaAlgeriaAntigua and BarbudaArab WorldArgentinaArmeniaAustraliaAustriaAzerbaijanBahamas, TheBahrainBangladeshBarbadosBelarusBelgiumBelizeBeninBhutanBoliviaBosnia and HerzegovinaBotswanaBrazilBrunei DarussalamBulgariaBurkina FasoBurundiCabo VerdeCambodiaCameroonCanadaCaribbean small statesCentral Europe and the BalticsChadChileChinaColombiaComorosCongo, Dem. Rep.Congo, Rep.Costa RicaCote d'IvoireCroatiaCubaCyprusCzech RepublicDenmarkDjiboutiDominican RepublicEarly-demographic dividendEast Asia & PacificEast Asia & Pacific (excluding high income)East Asia & Pacific (IDA & IBRD countries)EcuadorEgypt, Arab Rep.El SalvadorEquatorial GuineaEritreaEstoniaEthiopiaEuro areaEurope & Central AsiaEurope & Central Asia (excluding high income)Europe & Central Asia (IDA & IBRD countries)European UnionFijiFinlandFranceGabonGambia, TheGeorgiaGermanyGhanaGreeceGuatemalaGuineaGuinea-BissauHaitiHeavily indebted poor countries (HIPC)High incomeHondurasHong Kong SAR, ChinaHungaryIBRD onlyIcelandIDA & IBRD totalIDA blendIDA onlyIDA totalIndiaIndonesiaIran, Islamic Rep.IrelandIsraelItalyJamaicaJapanJordanKazakhstanKenyaKorea, Rep.KosovoKuwaitKyrgyz RepublicLao PDRLate-demographic dividendLatin America & Caribbean Latin America & Caribbean (excluding high income)Latin America & the Caribbean (IDA & IBRD countries)LatviaLebanonLiberiaLithuaniaLow & middle incomeLow incomeLower middle incomeLuxembourgMacao SAR, ChinaMacedonia, FYRMadagascarMalawiMalaysiaMaliMaltaMauritaniaMauritiusMexicoMiddle East & North AfricaMiddle East & North Africa (excluding high income)Middle East & North Africa (IDA & IBRD countries)Middle incomeMoldovaMongoliaMontenegroMoroccoMozambiqueNamibiaNepalNetherlandsNew ZealandNicaraguaNigerNigeriaNorth AmericaNorwayOECD membersOmanOther small statesPakistanPanamaPapua New GuineaParaguayPeruPhilippinesPolandPortugalPost-demographic dividendPuerto RicoQatarRomaniaRussian FederationRwandaSaudi ArabiaSenegalSerbiaSeychellesSierra LeoneSingaporeSlovak RepublicSloveniaSmall statesSomaliaSouth AfricaSouth AsiaSouth Asia (IDA & IBRD)South SudanSpainSri LankaSub-Saharan Africa Sub-Saharan Africa (excluding high income)Sub-Saharan Africa (IDA & IBRD countries)SudanSurinameSwazilandSwedenSwitzerlandSyrian Arab RepublicTajikistanTanzaniaThailandTimor-LesteTogoTrinidad and TobagoTunisiaTurkeyTurkmenistanUgandaUkraineUnited Arab EmiratesUnited KingdomUnited StatesUpper middle incomeUruguayVanuatuVenezuela, RBVietnamWest Bank and GazaWorldZimbabwe Timeline:
This timeline shows a graph from 1962 to 2014 of Mauritania. No data until 1961. Number of actual observations by date: 53.
Source name:
World Development Indicators
Source organization:
World Bank national accounts data, and OECD National Accounts data files.
Categories, topics:
Economy & Growth
Last updated:
apr 23, 2017
Indicators value changes by year
Minimum:
-25.068
jan 1, 1992
Maximum:
89.981
jan 1, 1977
At the date of observation
Value
Absolute change
Change from previous value
jan 1, 1962
3.774
+3.774
0.0%
jan 1, 1963
3.636
-0.137
-3.64%
jan 1, 1964
-5.614
-9.25
-254.39%
jan 1, 1965
-5.576
+0.038
-0.67%
jan 1, 1966
2.362
+7.938
-142.36%
jan 1, 1967
-5.27
-7.632
-323.08%
jan 1, 1968
-12.393
-7.123
135.18%
jan 1, 1969
-6.883
+5.51
-44.46%
jan 1, 1970
11.77
+18.653
-271.0%
jan 1, 1971
9.152
-2.618
-22.25%
jan 1, 1972
4.987
-4.165
-45.51%
jan 1, 1973
16.323
+11.336
227.33%
jan 1, 1974
1.146
-15.177
-92.98%
jan 1, 1975
15.322
+14.176
1.24K%
jan 1, 1976
19.334
+4.012
26.18%
jan 1, 1977
89.981
+70.647
365.41%
jan 1, 1978
0.678
-89.303
-99.25%
jan 1, 1979
-13.602
-14.279
-2.11K%
jan 1, 1980
-11.824
+1.777
-13.07%
jan 1, 1981
-12.027
-0.202
1.71%
jan 1, 1982
-11.456
+0.571
-4.75%
jan 1, 1983
-19.235
-7.779
67.91%
jan 1, 1984
6.765
+26.0
-135.17%
jan 1, 1985
-9.895
-16.66
-246.28%
jan 1, 1986
-3.679
+6.216
-62.82%
jan 1, 1987
-14.223
-10.544
286.58%
jan 1, 1988
7.659
+21.882
-153.85%
jan 1, 1989
5.1
-2.559
-33.41%
jan 1, 1990
4.246
-0.853
-16.73%
jan 1, 1991
-2.812
-7.059
-166.23%
jan 1, 1992
-25.068
-22.255
791.36%
jan 1, 1993
-25.068
+0.0
0.0%
jan 1, 1994
2.229
+27.297
-108.89%
jan 1, 1995
-0.619
-2.848
-127.76%
jan 1, 1996
-2.083
-1.464
236.58%
jan 1, 1997
6.824
+8.907
-427.59%
jan 1, 1998
0.195
-6.629
-97.15%
jan 1, 1999
15.524
+15.329
7.87K%
jan 1, 2000
15.398
-0.125
-0.81%
jan 1, 2001
9.81
-5.588
-36.29%
jan 1, 2002
1.918
-7.892
-80.45%
jan 1, 2003
36.523
+34.604
1.8K%
jan 1, 2004
22.21
-14.312
-39.19%
jan 1, 2005
-1.715
-23.926
-107.72%
jan 1, 2006
-0.982
+0.733
-42.75%
jan 1, 2007
11.987
+12.969
-1.32K%
jan 1, 2008
13.47
+1.483
12.37%
jan 1, 2009
-8.075
-21.545
-159.95%
jan 1, 2010
-4.499
+3.577
-44.29%
jan 1, 2011
9.993
+14.492
-322.15%
jan 1, 2012
3.953
-6.041
-60.45%
jan 1, 2013
11.36
+7.407
187.4%
jan 1, 2014
2.284
-9.075
-79.89%
Ranking of countries by current statistics by years


Comments: