29
/
en
AIzaSyAYiBZKx7MnpbEhh9jyipgxe19OcubqV5w
April 1, 2024
262254
Thailand
THA
true
2
1
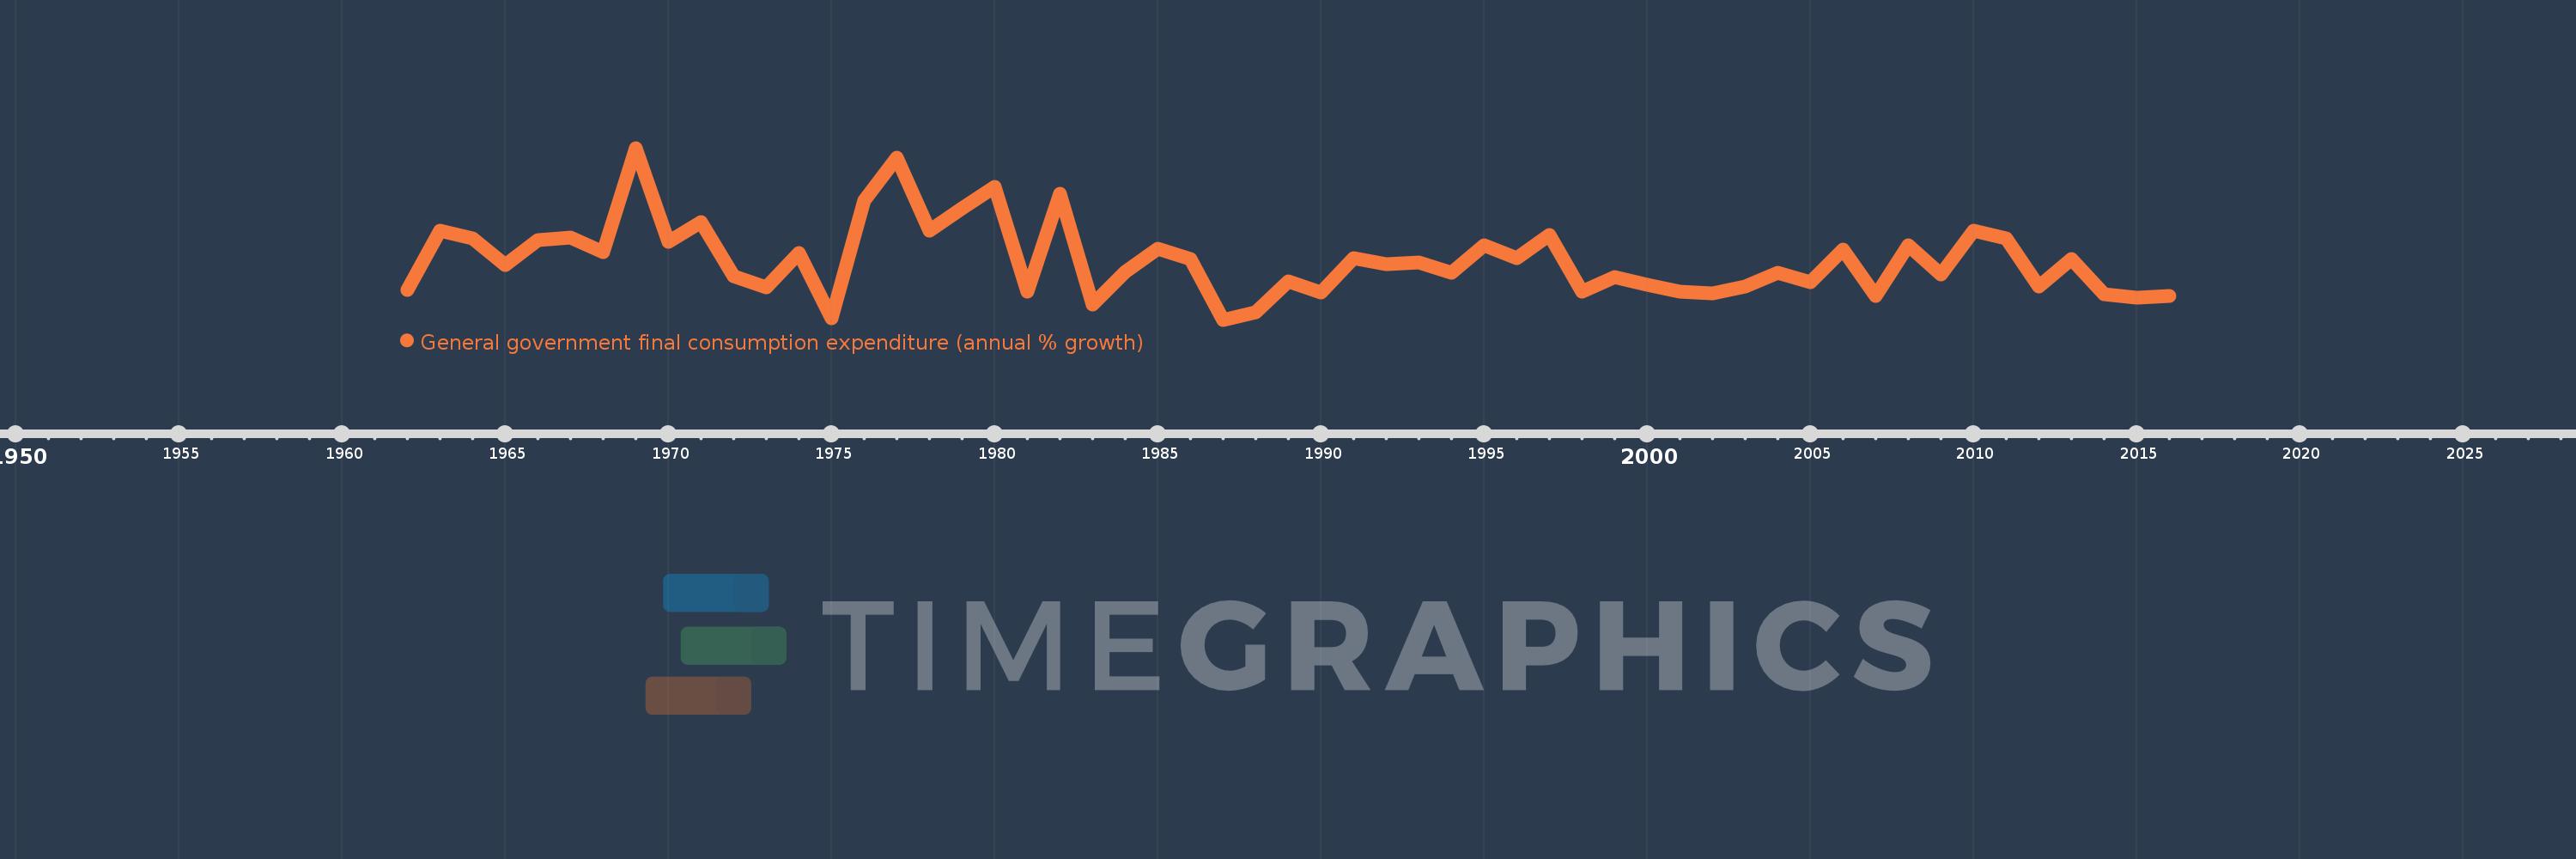
General government final consumption expenditure (annual % growth)
2016,2015,2014,2013,2012,2011,2010,2009,2008,2007,2006,2005,2004,2003,2002,2001,2000,1999,1998,1997,1996,1995,1994,1993,1992,1991,1990,1989,1988,1987,1986,1985,1984,1983,1982,1981,1980,1979,1978,1977,1976,1975,1974,1973,1972,1971,1970,1969,1968,1967,1966,1965,1964,1963,1962
This statistics in other country:
AlbaniaAlgeriaAntigua and BarbudaArab WorldArgentinaArmeniaAustraliaAustriaAzerbaijanBahamas, TheBahrainBangladeshBarbadosBelarusBelgiumBelizeBeninBhutanBoliviaBosnia and HerzegovinaBotswanaBrazilBrunei DarussalamBulgariaBurkina FasoBurundiCabo VerdeCambodiaCameroonCanadaCaribbean small statesCentral Europe and the BalticsChadChileChinaColombiaComorosCongo, Dem. Rep.Congo, Rep.Costa RicaCote d'IvoireCroatiaCubaCyprusCzech RepublicDenmarkDjiboutiDominican RepublicEarly-demographic dividendEast Asia & PacificEast Asia & Pacific (excluding high income)East Asia & Pacific (IDA & IBRD countries)EcuadorEgypt, Arab Rep.El SalvadorEquatorial GuineaEritreaEstoniaEthiopiaEuro areaEurope & Central AsiaEurope & Central Asia (excluding high income)Europe & Central Asia (IDA & IBRD countries)European UnionFijiFinlandFranceGabonGambia, TheGeorgiaGermanyGhanaGreeceGuatemalaGuineaGuinea-BissauHaitiHeavily indebted poor countries (HIPC)High incomeHondurasHong Kong SAR, ChinaHungaryIBRD onlyIcelandIDA & IBRD totalIDA blendIDA onlyIDA totalIndiaIndonesiaIran, Islamic Rep.IrelandIsraelItalyJamaicaJapanJordanKazakhstanKenyaKorea, Rep.KosovoKuwaitKyrgyz RepublicLao PDRLate-demographic dividendLatin America & Caribbean Latin America & Caribbean (excluding high income)Latin America & the Caribbean (IDA & IBRD countries)LatviaLebanonLiberiaLithuaniaLow & middle incomeLow incomeLower middle incomeLuxembourgMacao SAR, ChinaMacedonia, FYRMadagascarMalawiMalaysiaMaliMaltaMauritaniaMauritiusMexicoMiddle East & North AfricaMiddle East & North Africa (excluding high income)Middle East & North Africa (IDA & IBRD countries)Middle incomeMoldovaMongoliaMontenegroMoroccoMozambiqueNamibiaNepalNetherlandsNew ZealandNicaraguaNigerNigeriaNorth AmericaNorwayOECD membersOmanOther small statesPakistanPanamaPapua New GuineaParaguayPeruPhilippinesPolandPortugalPost-demographic dividendPuerto RicoQatarRomaniaRussian FederationRwandaSaudi ArabiaSenegalSerbiaSeychellesSierra LeoneSingaporeSlovak RepublicSloveniaSmall statesSomaliaSouth AfricaSouth AsiaSouth Asia (IDA & IBRD)South SudanSpainSri LankaSub-Saharan Africa Sub-Saharan Africa (excluding high income)Sub-Saharan Africa (IDA & IBRD countries)SudanSurinameSwazilandSwedenSwitzerlandSyrian Arab RepublicTajikistanTanzaniaThailandTimor-LesteTogoTrinidad and TobagoTunisiaTurkeyTurkmenistanUgandaUkraineUnited Arab EmiratesUnited KingdomUnited StatesUpper middle incomeUruguayVanuatuVenezuela, RBVietnamWest Bank and GazaWorldZimbabwe Timeline:
This timeline shows a graph from 1962 to 2016 of Thailand. No data until 1961. Number of actual observations by date: 55.
Source name:
World Development Indicators
Source organization:
World Bank national accounts data, and OECD National Accounts data files.
Categories, topics:
Economy & Growth
Last updated:
apr 23, 2017
Indicators value changes by year
Maximum:
20.535
jan 1, 1969
At the date of observation
Value
Absolute change
Change from previous value
jan 1, 1962
3.031
+3.031
0.0%
jan 1, 1963
10.294
+7.263
239.63%
jan 1, 1964
9.333
-0.961
-9.33%
jan 1, 1965
6.097
-3.236
-34.67%
jan 1, 1966
9.196
+3.099
50.82%
jan 1, 1967
9.474
+0.278
3.03%
jan 1, 1968
7.692
-1.782
-18.81%
jan 1, 1969
20.535
+12.843
166.95%
jan 1, 1970
8.889
-11.646
-56.71%
jan 1, 1971
11.345
+2.456
27.63%
jan 1, 1972
4.651
-6.694
-59.0%
jan 1, 1973
3.333
-1.318
-28.33%
jan 1, 1974
7.527
+4.194
125.8%
jan 1, 1975
-0.5
-8.027
-106.64%
jan 1, 1976
14.07
+14.57
-2.91K%
jan 1, 1977
19.383
+5.313
37.76%
jan 1, 1978
10.332
-9.051
-46.69%
jan 1, 1979
13.043
+2.711
26.24%
jan 1, 1980
15.681
+2.637
20.22%
jan 1, 1981
2.813
-12.868
-82.06%
jan 1, 1982
14.93
+12.117
430.73%
jan 1, 1983
1.237
-13.693
-91.72%
jan 1, 1984
5.252
+4.015
324.68%
jan 1, 1985
8.104
+2.852
54.3%
jan 1, 1986
6.838
-1.267
-15.63%
jan 1, 1987
-0.69
-7.528
-110.09%
jan 1, 1988
0.286
+0.976
-141.38%
jan 1, 1989
4.032
+3.746
1.31K%
jan 1, 1990
2.624
-1.408
-34.91%
jan 1, 1991
6.916
+4.292
163.56%
jan 1, 1992
6.191
-0.725
-10.48%
jan 1, 1993
6.401
+0.21
3.39%
jan 1, 1994
5.113
-1.287
-20.11%
jan 1, 1995
8.459
+3.346
65.43%
jan 1, 1996
6.889
-1.57
-18.56%
jan 1, 1997
9.809
+2.92
42.39%
jan 1, 1998
2.772
-7.037
-71.74%
jan 1, 1999
4.607
+1.835
66.2%
jan 1, 2000
3.607
-1.0
-21.7%
jan 1, 2001
2.759
-0.848
-23.51%
jan 1, 2002
2.598
-0.161
-5.85%
jan 1, 2003
3.413
+0.815
31.38%
jan 1, 2004
5.125
+1.712
50.17%
jan 1, 2005
3.897
-1.228
-23.97%
jan 1, 2006
7.994
+4.098
105.16%
jan 1, 2007
2.265
-5.73
-71.67%
jan 1, 2008
8.551
+6.286
277.61%
jan 1, 2009
4.926
-3.625
-42.39%
jan 1, 2010
10.272
+5.346
108.51%
jan 1, 2011
9.326
-0.946
-9.21%
jan 1, 2012
3.41
-5.917
-63.44%
jan 1, 2013
6.8
+3.391
99.44%
jan 1, 2014
2.493
-4.307
-63.34%
jan 1, 2015
2.071
-0.422
-16.92%
jan 1, 2016
2.202
+0.131
6.31%
Ranking of countries by current statistics by years


Comments: