29
/
en
AIzaSyAYiBZKx7MnpbEhh9jyipgxe19OcubqV5w
April 1, 2024
29869
Euro area
EMU
false
2
1
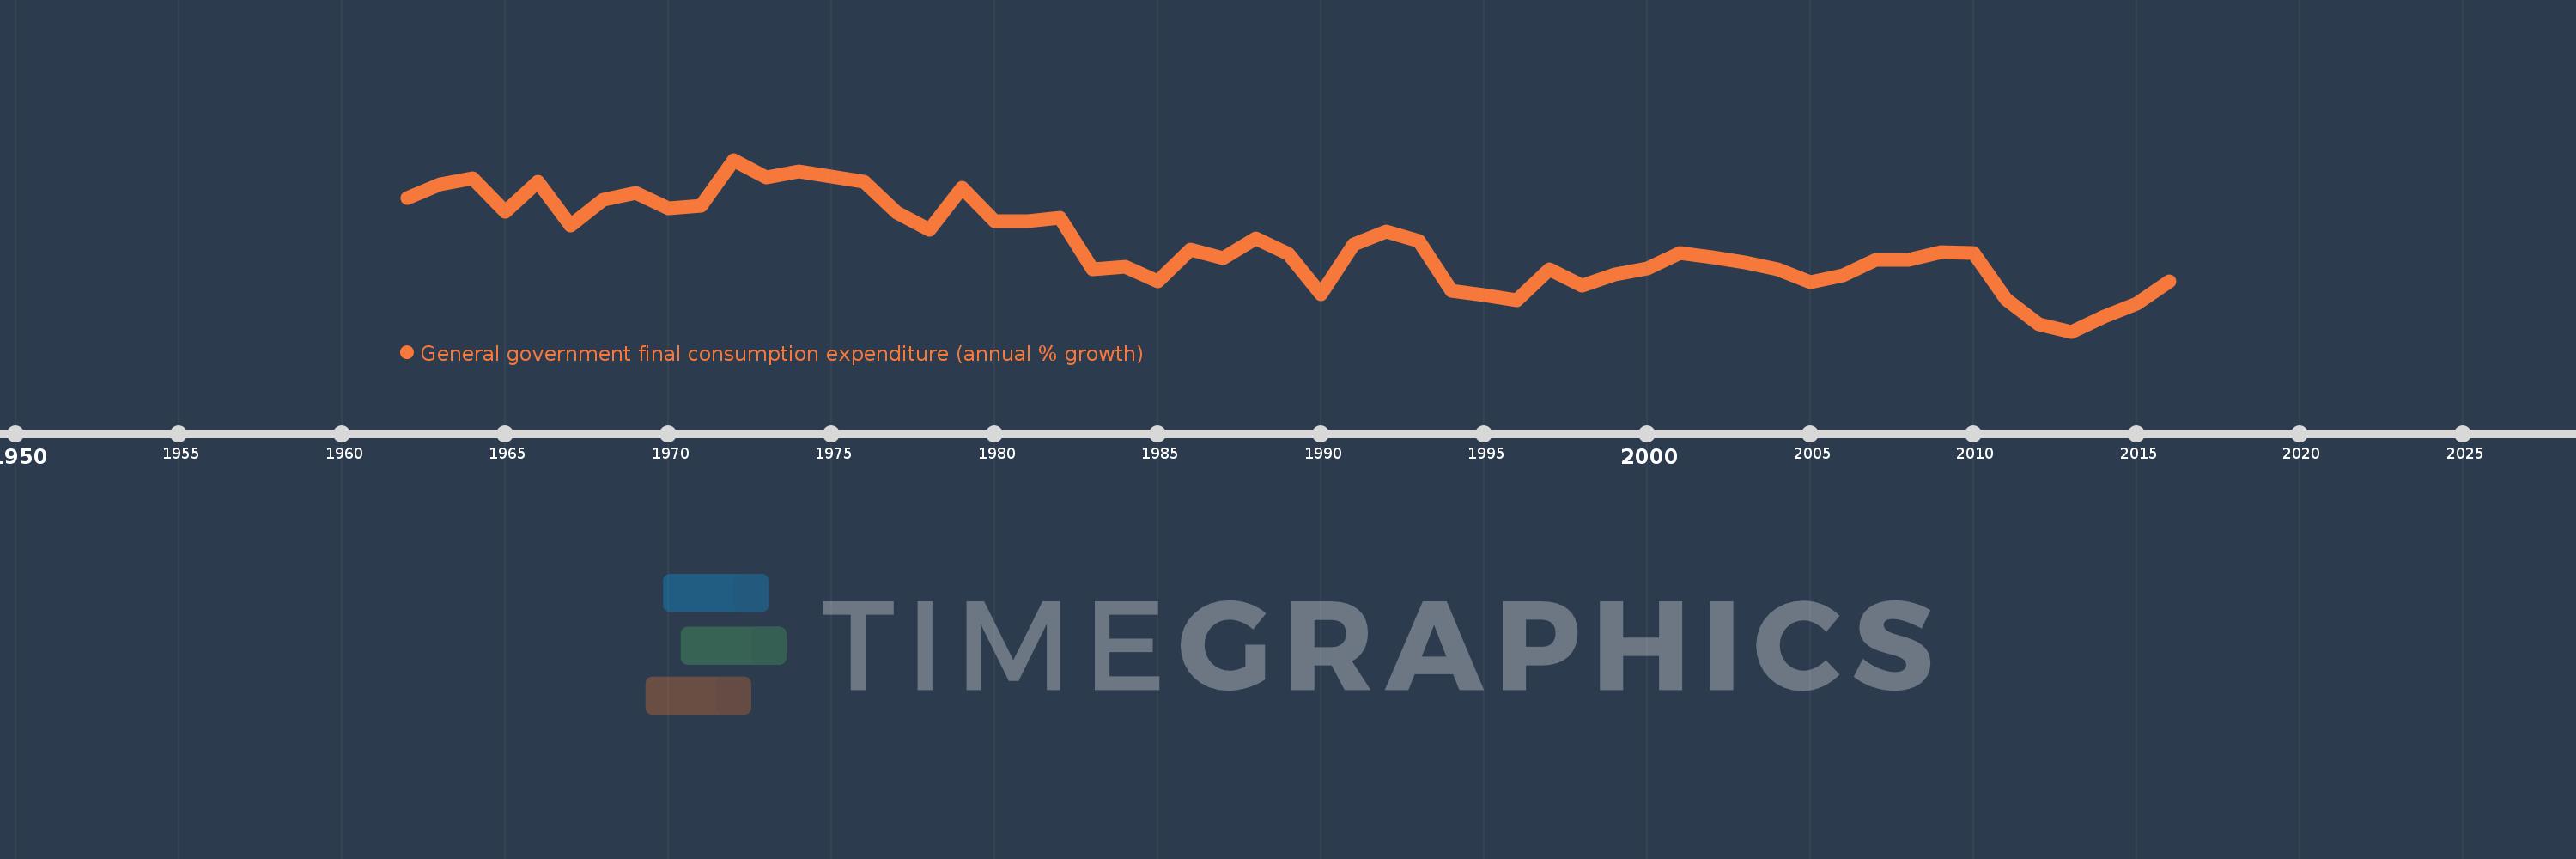
General government final consumption expenditure (annual % growth)
2016,2015,2014,2013,2012,2011,2010,2009,2008,2007,2006,2005,2004,2003,2002,2001,2000,1999,1998,1997,1996,1995,1994,1993,1992,1991,1990,1989,1988,1987,1986,1985,1984,1983,1982,1981,1980,1979,1978,1977,1976,1975,1974,1973,1972,1971,1970,1969,1968,1967,1966,1965,1964,1963,1962
This statistics in other country:
AlbaniaAlgeriaAntigua and BarbudaArab WorldArgentinaArmeniaAustraliaAustriaAzerbaijanBahamas, TheBahrainBangladeshBarbadosBelarusBelgiumBelizeBeninBhutanBoliviaBosnia and HerzegovinaBotswanaBrazilBrunei DarussalamBulgariaBurkina FasoBurundiCabo VerdeCambodiaCameroonCanadaCaribbean small statesCentral Europe and the BalticsChadChileChinaColombiaComorosCongo, Dem. Rep.Congo, Rep.Costa RicaCote d'IvoireCroatiaCubaCyprusCzech RepublicDenmarkDjiboutiDominican RepublicEarly-demographic dividendEast Asia & PacificEast Asia & Pacific (excluding high income)East Asia & Pacific (IDA & IBRD countries)EcuadorEgypt, Arab Rep.El SalvadorEquatorial GuineaEritreaEstoniaEthiopiaEuro areaEurope & Central AsiaEurope & Central Asia (excluding high income)Europe & Central Asia (IDA & IBRD countries)European UnionFijiFinlandFranceGabonGambia, TheGeorgiaGermanyGhanaGreeceGuatemalaGuineaGuinea-BissauHaitiHeavily indebted poor countries (HIPC)High incomeHondurasHong Kong SAR, ChinaHungaryIBRD onlyIcelandIDA & IBRD totalIDA blendIDA onlyIDA totalIndiaIndonesiaIran, Islamic Rep.IrelandIsraelItalyJamaicaJapanJordanKazakhstanKenyaKorea, Rep.KosovoKuwaitKyrgyz RepublicLao PDRLate-demographic dividendLatin America & Caribbean Latin America & Caribbean (excluding high income)Latin America & the Caribbean (IDA & IBRD countries)LatviaLebanonLiberiaLithuaniaLow & middle incomeLow incomeLower middle incomeLuxembourgMacao SAR, ChinaMacedonia, FYRMadagascarMalawiMalaysiaMaliMaltaMauritaniaMauritiusMexicoMiddle East & North AfricaMiddle East & North Africa (excluding high income)Middle East & North Africa (IDA & IBRD countries)Middle incomeMoldovaMongoliaMontenegroMoroccoMozambiqueNamibiaNepalNetherlandsNew ZealandNicaraguaNigerNigeriaNorth AmericaNorwayOECD membersOmanOther small statesPakistanPanamaPapua New GuineaParaguayPeruPhilippinesPolandPortugalPost-demographic dividendPuerto RicoQatarRomaniaRussian FederationRwandaSaudi ArabiaSenegalSerbiaSeychellesSierra LeoneSingaporeSlovak RepublicSloveniaSmall statesSomaliaSouth AfricaSouth AsiaSouth Asia (IDA & IBRD)South SudanSpainSri LankaSub-Saharan Africa Sub-Saharan Africa (excluding high income)Sub-Saharan Africa (IDA & IBRD countries)SudanSurinameSwazilandSwedenSwitzerlandSyrian Arab RepublicTajikistanTanzaniaThailandTimor-LesteTogoTrinidad and TobagoTunisiaTurkeyTurkmenistanUgandaUkraineUnited Arab EmiratesUnited KingdomUnited StatesUpper middle incomeUruguayVanuatuVenezuela, RBVietnamWest Bank and GazaWorldZimbabwe Timeline:
This timeline shows a graph from 1962 to 2016 of Euro area. No data until 1961. Number of actual observations by date: 55.
Source name:
World Development Indicators
Source organization:
World Bank national accounts data, and OECD National Accounts data files.
Categories, topics:
Economy & Growth
Last updated:
apr 23, 2017
Indicators value changes by year
Minimum:
-0.342
jan 1, 2013
At the date of observation
Value
Absolute change
Change from previous value
jan 1, 1962
4.313
+4.313
0.0%
jan 1, 1963
4.792
+0.479
11.11%
jan 1, 1964
5.0
+0.208
4.35%
jan 1, 1965
3.825
-1.176
-23.52%
jan 1, 1966
4.872
+1.047
27.38%
jan 1, 1967
3.342
-1.529
-31.39%
jan 1, 1968
4.261
+0.918
27.47%
jan 1, 1969
4.497
+0.237
5.55%
jan 1, 1970
3.951
-0.546
-12.14%
jan 1, 1971
4.047
+0.095
2.41%
jan 1, 1972
5.647
+1.6
39.54%
jan 1, 1973
5.026
-0.621
-11.0%
jan 1, 1974
5.232
+0.207
4.11%
jan 1, 1975
5.061
-0.172
-3.28%
jan 1, 1976
4.873
-0.188
-3.72%
jan 1, 1977
3.813
-1.06
-21.76%
jan 1, 1978
3.22
-0.593
-15.55%
jan 1, 1979
4.678
+1.458
45.3%
jan 1, 1980
3.512
-1.166
-24.93%
jan 1, 1981
3.502
-0.01
-0.28%
jan 1, 1982
3.63
+0.128
3.65%
jan 1, 1983
1.833
-1.796
-49.48%
jan 1, 1984
1.904
+0.07
3.82%
jan 1, 1985
1.406
-0.497
-26.13%
jan 1, 1986
2.508
+1.102
78.38%
jan 1, 1987
2.206
-0.303
-12.06%
jan 1, 1988
2.894
+0.688
31.2%
jan 1, 1989
2.37
-0.524
-18.11%
jan 1, 1990
0.954
-1.416
-59.76%
jan 1, 1991
2.712
+1.758
184.39%
jan 1, 1992
3.156
+0.444
16.35%
jan 1, 1993
2.831
-0.325
-10.3%
jan 1, 1994
1.092
-1.739
-61.42%
jan 1, 1995
0.925
-0.167
-15.32%
jan 1, 1996
0.757
-0.168
-18.16%
jan 1, 1997
1.836
+1.08
142.62%
jan 1, 1998
1.256
-0.58
-31.6%
jan 1, 1999
1.653
+0.396
31.57%
jan 1, 2000
1.859
+0.206
12.47%
jan 1, 2001
2.405
+0.547
29.41%
jan 1, 2002
2.245
-0.16
-6.66%
jan 1, 2003
2.068
-0.177
-7.9%
jan 1, 2004
1.84
-0.228
-11.03%
jan 1, 2005
1.376
-0.464
-25.21%
jan 1, 2006
1.622
+0.246
17.86%
jan 1, 2007
2.167
+0.546
33.64%
jan 1, 2008
2.153
-0.014
-0.64%
jan 1, 2009
2.428
+0.274
12.74%
jan 1, 2010
2.408
-0.019
-0.8%
jan 1, 2011
0.789
-1.619
-67.25%
jan 1, 2012
-0.083
-0.872
-110.55%
jan 1, 2013
-0.342
-0.259
311.44%
jan 1, 2014
0.174
+0.516
-150.86%
jan 1, 2015
0.623
+0.449
257.99%
jan 1, 2016
1.414
+0.791
126.87%
Ranking of countries by current statistics by years


Comments: