29
/
en
AIzaSyAYiBZKx7MnpbEhh9jyipgxe19OcubqV5w
April 1, 2024
126188
El Salvador
SLV
true
2
1
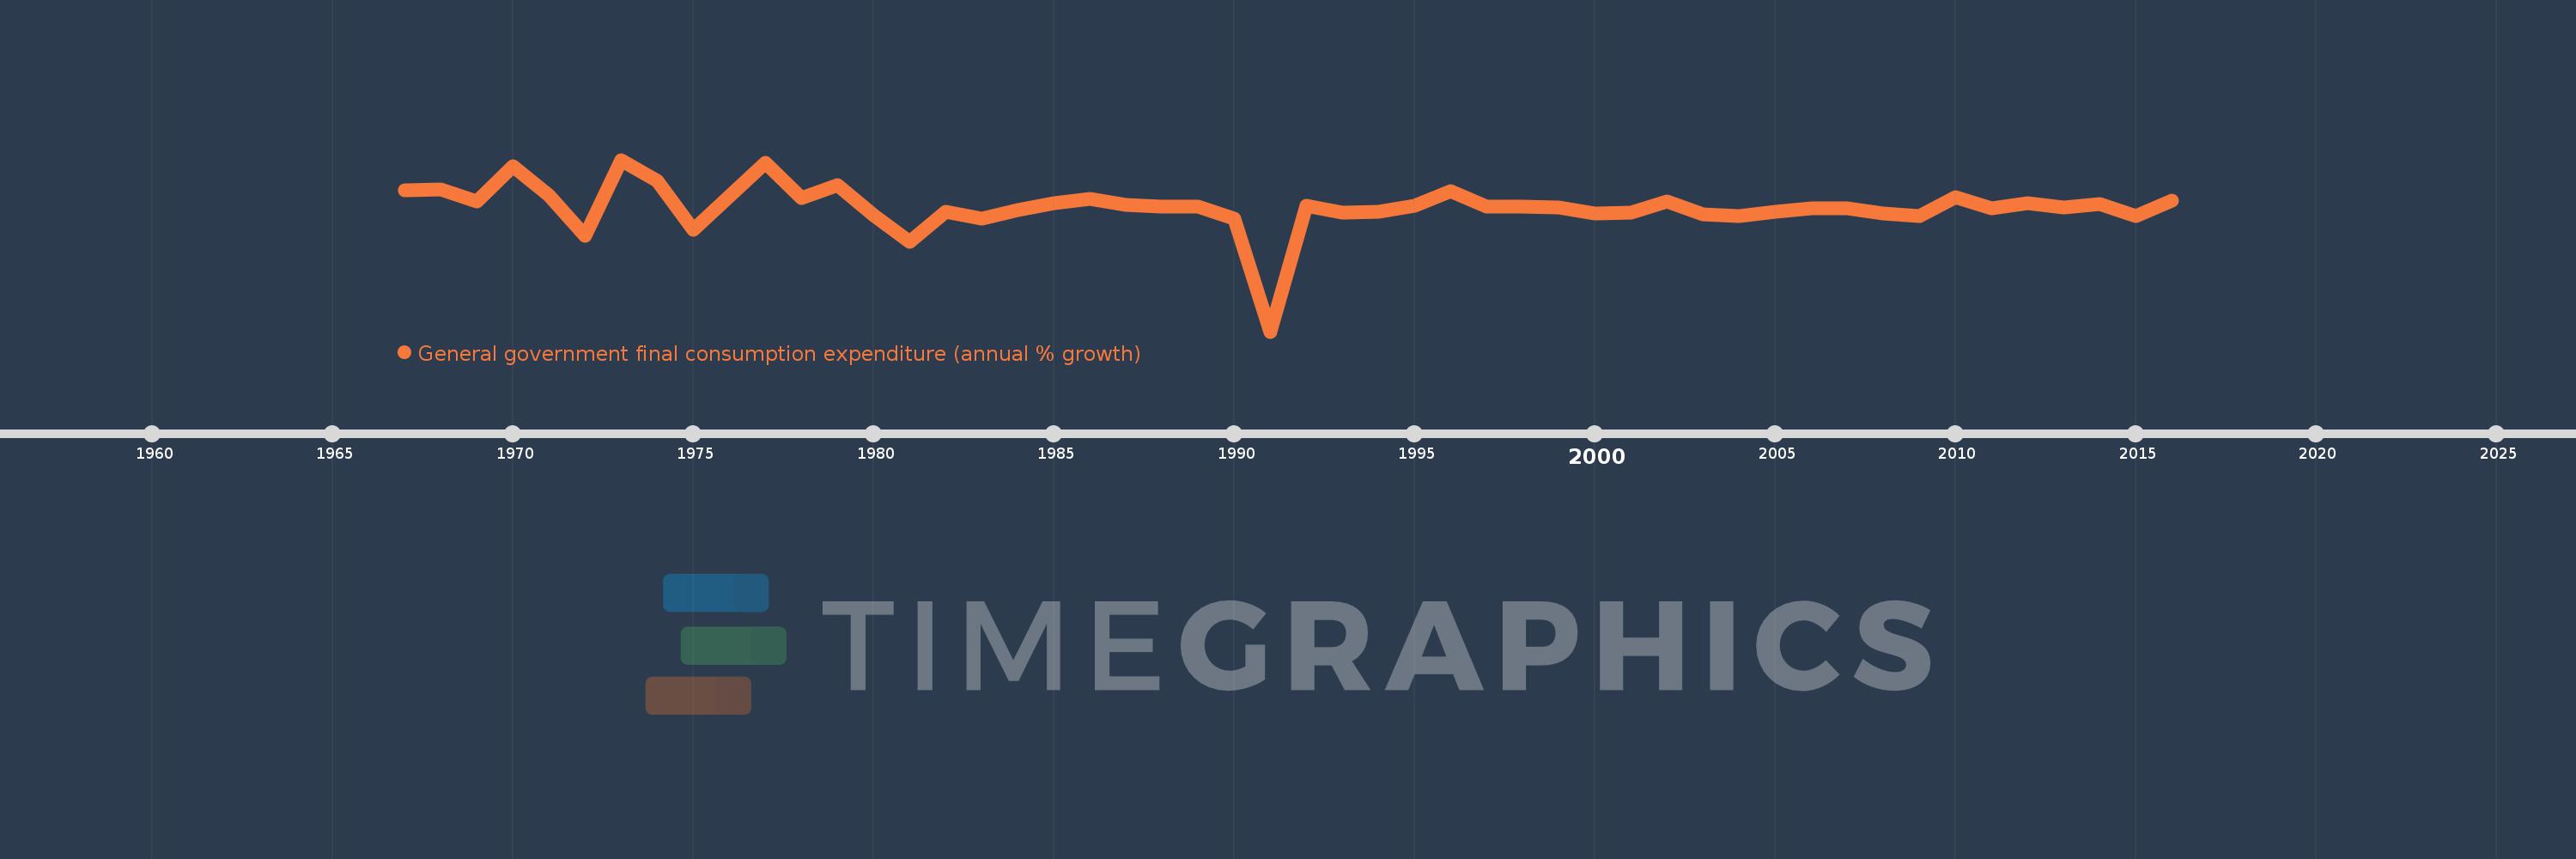
General government final consumption expenditure (annual % growth)
2016,2015,2014,2013,2012,2011,2010,2009,2008,2007,2006,2005,2004,2003,2002,2001,2000,1999,1998,1997,1996,1995,1994,1993,1992,1991,1990,1989,1988,1987,1986,1985,1984,1983,1982,1981,1980,1979,1978,1977,1976,1975,1974,1973,1972,1971,1970,1969,1968,1967
This statistics in other country:
AlbaniaAlgeriaAntigua and BarbudaArab WorldArgentinaArmeniaAustraliaAustriaAzerbaijanBahamas, TheBahrainBangladeshBarbadosBelarusBelgiumBelizeBeninBhutanBoliviaBosnia and HerzegovinaBotswanaBrazilBrunei DarussalamBulgariaBurkina FasoBurundiCabo VerdeCambodiaCameroonCanadaCaribbean small statesCentral Europe and the BalticsChadChileChinaColombiaComorosCongo, Dem. Rep.Congo, Rep.Costa RicaCote d'IvoireCroatiaCubaCyprusCzech RepublicDenmarkDjiboutiDominican RepublicEarly-demographic dividendEast Asia & PacificEast Asia & Pacific (excluding high income)East Asia & Pacific (IDA & IBRD countries)EcuadorEgypt, Arab Rep.El SalvadorEquatorial GuineaEritreaEstoniaEthiopiaEuro areaEurope & Central AsiaEurope & Central Asia (excluding high income)Europe & Central Asia (IDA & IBRD countries)European UnionFijiFinlandFranceGabonGambia, TheGeorgiaGermanyGhanaGreeceGuatemalaGuineaGuinea-BissauHaitiHeavily indebted poor countries (HIPC)High incomeHondurasHong Kong SAR, ChinaHungaryIBRD onlyIcelandIDA & IBRD totalIDA blendIDA onlyIDA totalIndiaIndonesiaIran, Islamic Rep.IrelandIsraelItalyJamaicaJapanJordanKazakhstanKenyaKorea, Rep.KosovoKuwaitKyrgyz RepublicLao PDRLate-demographic dividendLatin America & Caribbean Latin America & Caribbean (excluding high income)Latin America & the Caribbean (IDA & IBRD countries)LatviaLebanonLiberiaLithuaniaLow & middle incomeLow incomeLower middle incomeLuxembourgMacao SAR, ChinaMacedonia, FYRMadagascarMalawiMalaysiaMaliMaltaMauritaniaMauritiusMexicoMiddle East & North AfricaMiddle East & North Africa (excluding high income)Middle East & North Africa (IDA & IBRD countries)Middle incomeMoldovaMongoliaMontenegroMoroccoMozambiqueNamibiaNepalNetherlandsNew ZealandNicaraguaNigerNigeriaNorth AmericaNorwayOECD membersOmanOther small statesPakistanPanamaPapua New GuineaParaguayPeruPhilippinesPolandPortugalPost-demographic dividendPuerto RicoQatarRomaniaRussian FederationRwandaSaudi ArabiaSenegalSerbiaSeychellesSierra LeoneSingaporeSlovak RepublicSloveniaSmall statesSomaliaSouth AfricaSouth AsiaSouth Asia (IDA & IBRD)South SudanSpainSri LankaSub-Saharan Africa Sub-Saharan Africa (excluding high income)Sub-Saharan Africa (IDA & IBRD countries)SudanSurinameSwazilandSwedenSwitzerlandSyrian Arab RepublicTajikistanTanzaniaThailandTimor-LesteTogoTrinidad and TobagoTunisiaTurkeyTurkmenistanUgandaUkraineUnited Arab EmiratesUnited KingdomUnited StatesUpper middle incomeUruguayVanuatuVenezuela, RBVietnamWest Bank and GazaWorldZimbabwe Timeline:
This timeline shows a graph from 1967 to 2016 of El Salvador. No data until 1966. Number of actual observations by date: 50.
Source name:
World Development Indicators
Source organization:
World Bank national accounts data, and OECD National Accounts data files.
Categories, topics:
Economy & Growth
Last updated:
apr 23, 2017
Indicators value changes by year
Minimum:
-38.013
jan 1, 1991
Maximum:
18.048
jan 1, 1973
At the date of observation
Value
Absolute change
Change from previous value
jan 1, 1967
7.986
+7.986
0.0%
jan 1, 1968
8.335
+0.349
4.37%
jan 1, 1969
4.517
-3.817
-45.8%
jan 1, 1970
15.854
+11.337
250.96%
jan 1, 1971
6.484
-9.37
-59.1%
jan 1, 1972
-6.718
-13.202
-203.6%
jan 1, 1973
18.048
+24.765
-368.66%
jan 1, 1974
11.317
-6.731
-37.3%
jan 1, 1975
-4.868
-16.184
-143.01%
jan 1, 1976
6.063
+10.93
-224.55%
jan 1, 1977
16.947
+10.885
179.54%
jan 1, 1978
5.655
-11.293
-66.63%
jan 1, 1979
9.869
+4.215
74.53%
jan 1, 1980
-0.088
-9.957
-100.89%
jan 1, 1981
-8.773
-8.685
9.88K%
jan 1, 1982
1.088
+9.861
-112.4%
jan 1, 1983
-1.154
-2.242
-206.02%
jan 1, 1984
1.751
+2.904
-251.75%
jan 1, 1985
3.839
+2.088
119.28%
jan 1, 1986
5.344
+1.505
39.21%
jan 1, 1987
3.284
-2.06
-38.55%
jan 1, 1988
2.828
-0.457
-13.9%
jan 1, 1989
2.738
-0.09
-3.18%
jan 1, 1990
-1.262
-4.0
-146.1%
jan 1, 1991
-38.013
-36.751
2.91K%
jan 1, 1992
3.13
+41.143
-108.23%
jan 1, 1993
0.856
-2.275
-72.67%
jan 1, 1994
0.99
+0.134
15.68%
jan 1, 1995
3.02
+2.03
205.14%
jan 1, 1996
7.901
+4.881
161.64%
jan 1, 1997
2.807
-5.095
-64.48%
jan 1, 1998
2.765
-0.042
-1.48%
jan 1, 1999
2.503
-0.262
-9.47%
jan 1, 2000
0.415
-2.088
-83.41%
jan 1, 2001
0.943
+0.528
127.06%
jan 1, 2002
4.557
+3.614
383.16%
jan 1, 2003
0.11
-4.447
-97.59%
jan 1, 2004
-0.313
-0.423
-385.4%
jan 1, 2005
1.068
+1.381
-441.07%
jan 1, 2006
2.098
+1.03
96.43%
jan 1, 2007
2.192
+0.094
4.47%
jan 1, 2008
0.447
-1.745
-79.61%
jan 1, 2009
-0.356
-0.803
-179.64%
jan 1, 2010
5.849
+6.205
-1.74K%
jan 1, 2011
2.222
-3.627
-62.02%
jan 1, 2012
3.865
+1.644
73.98%
jan 1, 2013
2.476
-1.389
-35.93%
jan 1, 2014
3.748
+1.271
51.33%
jan 1, 2015
-0.411
-4.159
-110.97%
jan 1, 2016
4.69
+5.101
-1.24K%
Ranking of countries by current statistics by years


Comments: