29
/
en
AIzaSyAYiBZKx7MnpbEhh9jyipgxe19OcubqV5w
April 1, 2024
185186
Madagascar
MDG
true
2
1
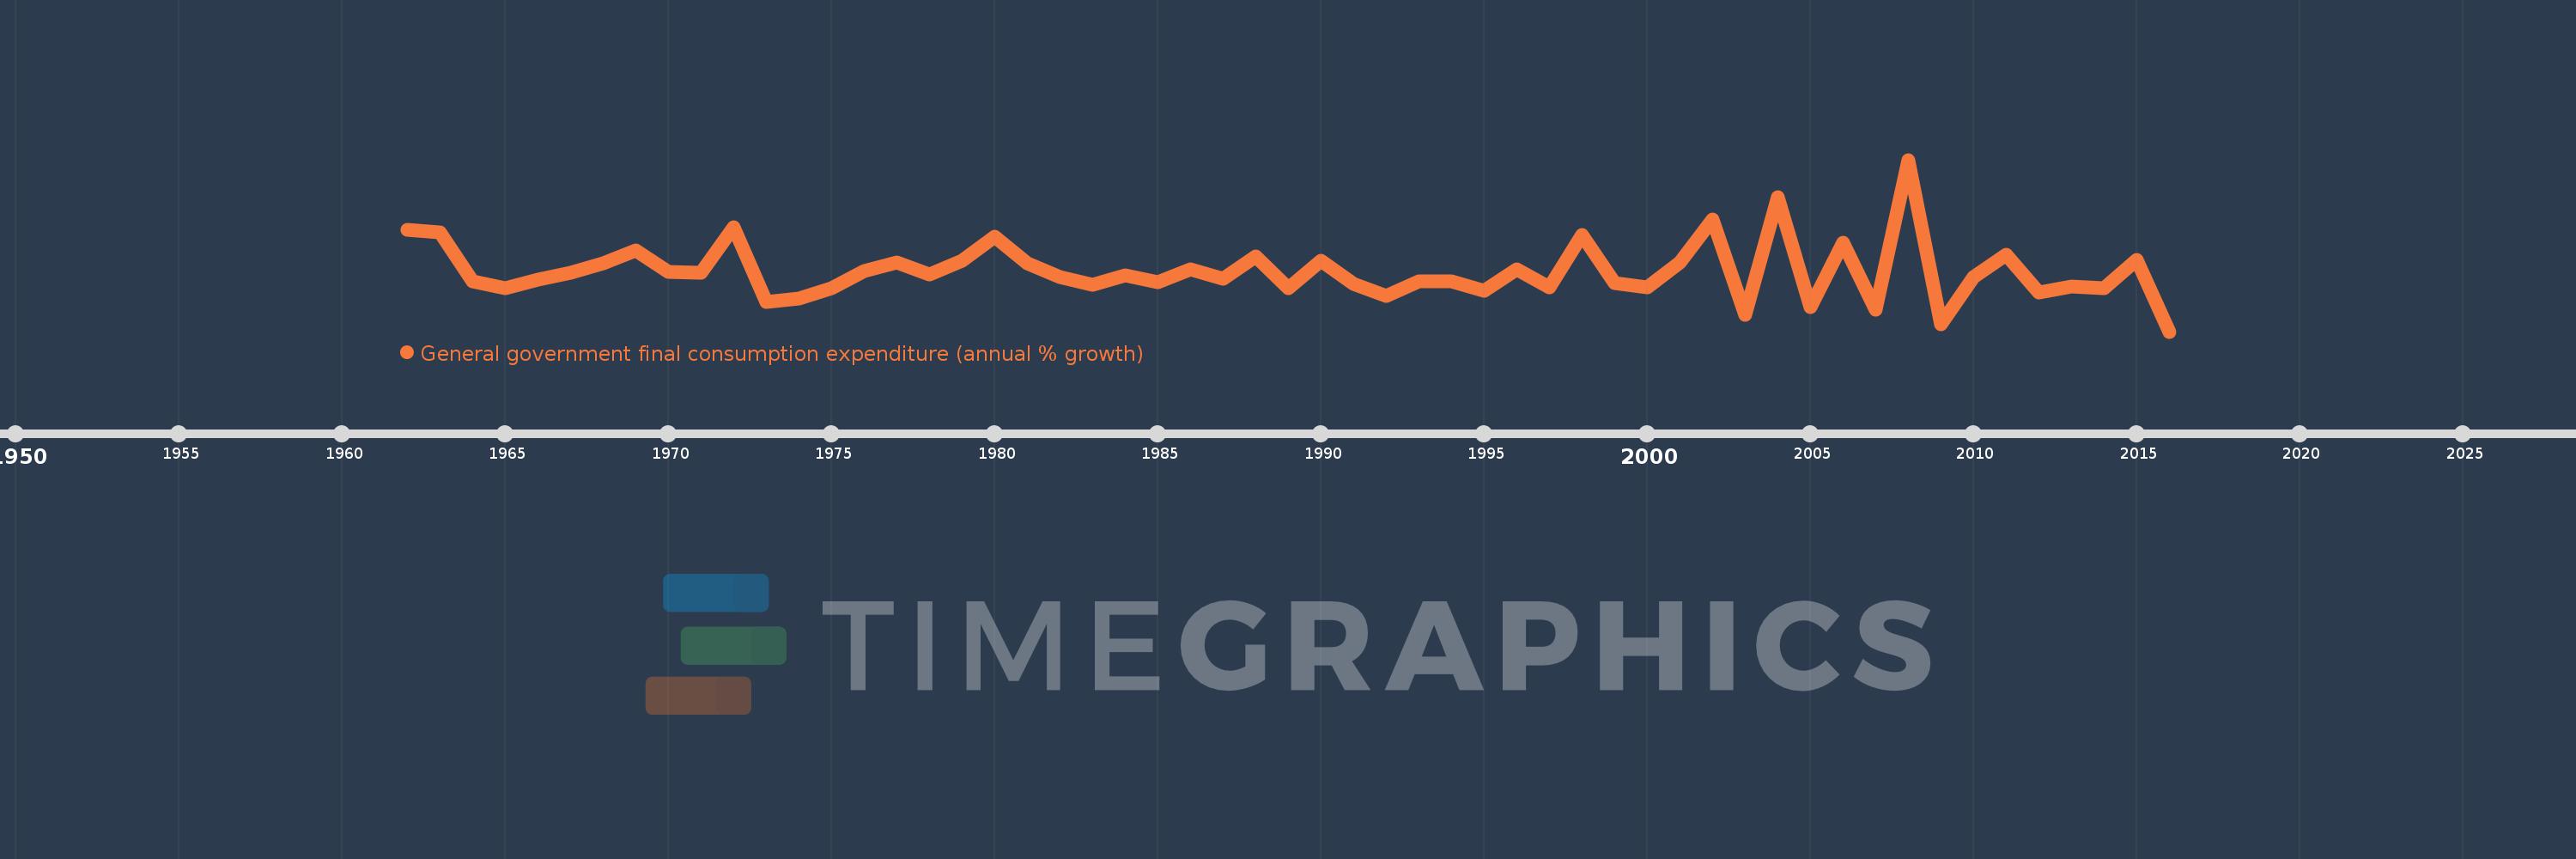
General government final consumption expenditure (annual % growth)
2016,2015,2014,2013,2012,2011,2010,2009,2008,2007,2006,2005,2004,2003,2002,2001,2000,1999,1998,1997,1996,1995,1994,1993,1992,1991,1990,1989,1988,1987,1986,1985,1984,1983,1982,1981,1980,1979,1978,1977,1976,1975,1974,1973,1972,1971,1970,1969,1968,1967,1966,1965,1964,1963,1962
This statistics in other country:
AlbaniaAlgeriaAntigua and BarbudaArab WorldArgentinaArmeniaAustraliaAustriaAzerbaijanBahamas, TheBahrainBangladeshBarbadosBelarusBelgiumBelizeBeninBhutanBoliviaBosnia and HerzegovinaBotswanaBrazilBrunei DarussalamBulgariaBurkina FasoBurundiCabo VerdeCambodiaCameroonCanadaCaribbean small statesCentral Europe and the BalticsChadChileChinaColombiaComorosCongo, Dem. Rep.Congo, Rep.Costa RicaCote d'IvoireCroatiaCubaCyprusCzech RepublicDenmarkDjiboutiDominican RepublicEarly-demographic dividendEast Asia & PacificEast Asia & Pacific (excluding high income)East Asia & Pacific (IDA & IBRD countries)EcuadorEgypt, Arab Rep.El SalvadorEquatorial GuineaEritreaEstoniaEthiopiaEuro areaEurope & Central AsiaEurope & Central Asia (excluding high income)Europe & Central Asia (IDA & IBRD countries)European UnionFijiFinlandFranceGabonGambia, TheGeorgiaGermanyGhanaGreeceGuatemalaGuineaGuinea-BissauHaitiHeavily indebted poor countries (HIPC)High incomeHondurasHong Kong SAR, ChinaHungaryIBRD onlyIcelandIDA & IBRD totalIDA blendIDA onlyIDA totalIndiaIndonesiaIran, Islamic Rep.IrelandIsraelItalyJamaicaJapanJordanKazakhstanKenyaKorea, Rep.KosovoKuwaitKyrgyz RepublicLao PDRLate-demographic dividendLatin America & Caribbean Latin America & Caribbean (excluding high income)Latin America & the Caribbean (IDA & IBRD countries)LatviaLebanonLiberiaLithuaniaLow & middle incomeLow incomeLower middle incomeLuxembourgMacao SAR, ChinaMacedonia, FYRMadagascarMalawiMalaysiaMaliMaltaMauritaniaMauritiusMexicoMiddle East & North AfricaMiddle East & North Africa (excluding high income)Middle East & North Africa (IDA & IBRD countries)Middle incomeMoldovaMongoliaMontenegroMoroccoMozambiqueNamibiaNepalNetherlandsNew ZealandNicaraguaNigerNigeriaNorth AmericaNorwayOECD membersOmanOther small statesPakistanPanamaPapua New GuineaParaguayPeruPhilippinesPolandPortugalPost-demographic dividendPuerto RicoQatarRomaniaRussian FederationRwandaSaudi ArabiaSenegalSerbiaSeychellesSierra LeoneSingaporeSlovak RepublicSloveniaSmall statesSomaliaSouth AfricaSouth AsiaSouth Asia (IDA & IBRD)South SudanSpainSri LankaSub-Saharan Africa Sub-Saharan Africa (excluding high income)Sub-Saharan Africa (IDA & IBRD countries)SudanSurinameSwazilandSwedenSwitzerlandSyrian Arab RepublicTajikistanTanzaniaThailandTimor-LesteTogoTrinidad and TobagoTunisiaTurkeyTurkmenistanUgandaUkraineUnited Arab EmiratesUnited KingdomUnited StatesUpper middle incomeUruguayVanuatuVenezuela, RBVietnamWest Bank and GazaWorldZimbabwe Timeline:
This timeline shows a graph from 1962 to 2016 of Madagascar. No data until 1961. Number of actual observations by date: 55.
Source name:
World Development Indicators
Source organization:
World Bank national accounts data, and OECD National Accounts data files.
Categories, topics:
Economy & Growth
Last updated:
apr 23, 2017
Indicators value changes by year
Minimum:
-19.512
jan 1, 2016
Maximum:
41.519
jan 1, 2008
At the date of observation
Value
Absolute change
Change from previous value
jan 1, 1962
16.612
+16.612
0.0%
jan 1, 1963
15.643
-0.969
-5.83%
jan 1, 1964
-1.692
-17.335
-110.81%
jan 1, 1965
-4.176
-2.485
146.9%
jan 1, 1966
-1.026
+3.15
-75.43%
jan 1, 1967
1.295
+2.321
-226.27%
jan 1, 1968
4.604
+3.308
255.36%
jan 1, 1969
9.291
+4.687
101.81%
jan 1, 1970
1.789
-7.501
-80.74%
jan 1, 1971
1.319
-0.471
-26.31%
jan 1, 1972
17.57
+16.252
1.23K%
jan 1, 1973
-8.856
-26.427
-150.4%
jan 1, 1974
-7.692
+1.164
-13.14%
jan 1, 1975
-4.167
+3.526
-45.83%
jan 1, 1976
2.06
+6.227
-149.44%
jan 1, 1977
4.932
+2.872
139.44%
jan 1, 1978
0.641
-4.291
-87.0%
jan 1, 1979
5.732
+5.091
793.7%
jan 1, 1980
14.257
+8.525
148.72%
jan 1, 1981
4.745
-9.512
-66.72%
jan 1, 1982
-0.168
-4.913
-103.53%
jan 1, 1983
-3.025
-2.858
1.7K%
jan 1, 1984
0.346
+3.372
-111.45%
jan 1, 1985
-2.067
-2.413
-696.57%
jan 1, 1986
2.481
+4.548
-220.04%
jan 1, 1987
-0.619
-3.1
-124.95%
jan 1, 1988
7.1
+7.719
-1.25K%
jan 1, 1989
-4.218
-11.318
-159.4%
jan 1, 1990
5.699
+9.916
-235.11%
jan 1, 1991
-2.688
-8.386
-147.16%
jan 1, 1992
-6.954
-4.267
158.74%
jan 1, 1993
-1.605
+5.349
-76.92%
jan 1, 1994
-1.53
+0.076
-4.72%
jan 1, 1995
-4.957
-3.428
224.1%
jan 1, 1996
2.732
+7.69
-155.12%
jan 1, 1997
-3.782
-6.514
-238.39%
jan 1, 1998
14.789
+18.57
-491.07%
jan 1, 1999
-2.173
-16.961
-114.69%
jan 1, 2000
-3.723
-1.55
71.33%
jan 1, 2001
5.086
+8.809
-236.63%
jan 1, 2002
20.349
+15.263
300.08%
jan 1, 2003
-13.527
-33.875
-166.47%
jan 1, 2004
28.363
+41.89
-309.68%
jan 1, 2005
-10.78
-39.143
-138.01%
jan 1, 2006
12.008
+22.789
-211.39%
jan 1, 2007
-11.588
-23.596
-196.5%
jan 1, 2008
41.519
+53.108
-458.29%
jan 1, 2009
-16.916
-58.435
-140.74%
jan 1, 2010
-0.272
+16.644
-98.39%
jan 1, 2011
7.649
+7.92
-2.92K%
jan 1, 2012
-5.555
-13.204
-172.63%
jan 1, 2013
-3.394
+2.161
-38.9%
jan 1, 2014
-4.12
-0.726
21.38%
jan 1, 2015
5.958
+10.078
-244.61%
jan 1, 2016
-19.512
-25.47
-427.49%
Ranking of countries by current statistics by years


Comments: