29
/
en
AIzaSyAYiBZKx7MnpbEhh9jyipgxe19OcubqV5w
April 1, 2024
73967
Austria
AUT
true
2
1
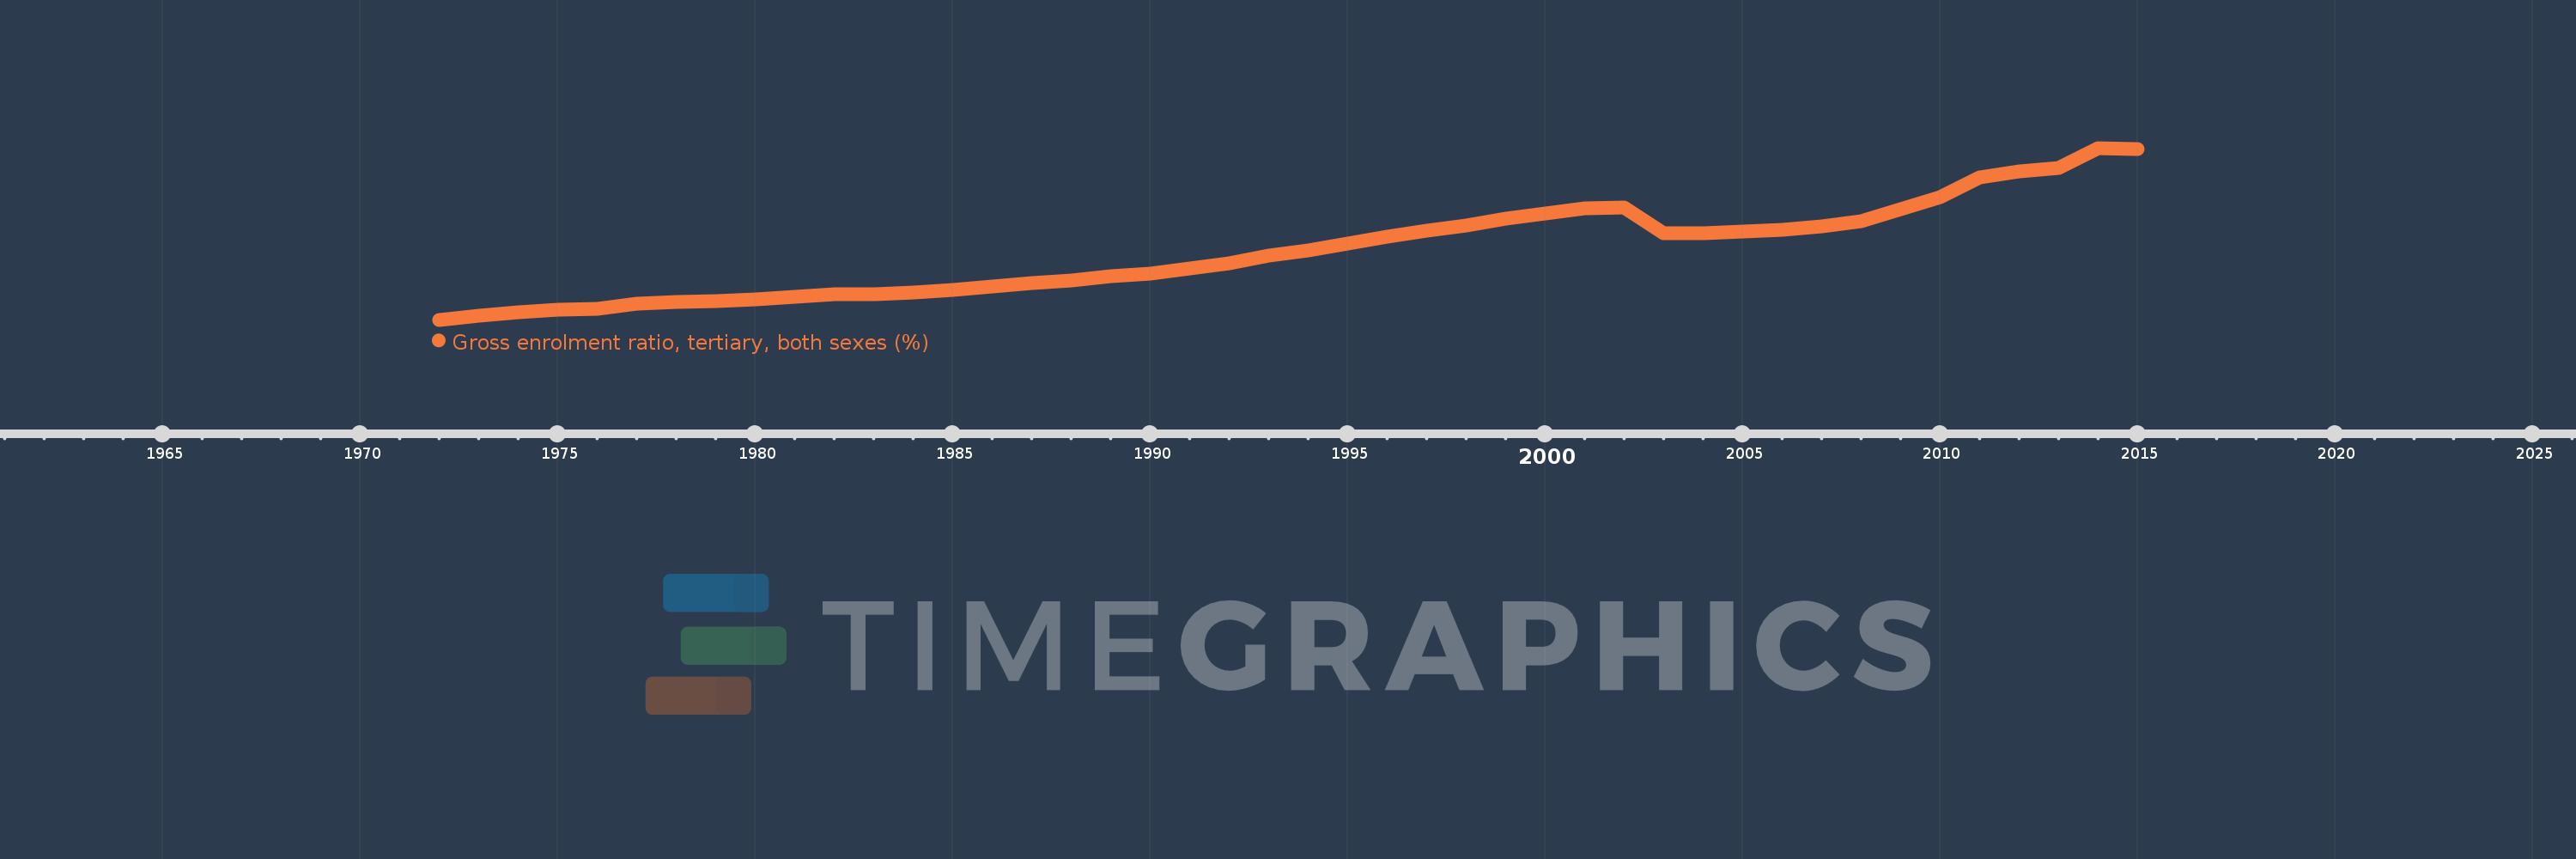
Gross enrolment ratio, tertiary, both sexes (%)
2015,2014,2013,2012,2011,2010,2009,2008,2007,2006,2005,2004,2003,2002,2001,2000,1999,1998,1997,1996,1995,1994,1993,1992,1991,1990,1989,1988,1987,1986,1985,1984,1983,1982,1981,1980,1979,1978,1977,1976,1975,1974,1973,1972
This statistics in other country:
AfghanistanAlbaniaAlgeriaAngolaAntigua and BarbudaArab WorldArgentinaArmeniaArubaAustraliaAustriaAzerbaijanBahamas, TheBahrainBangladeshBarbadosBelarusBelgiumBelizeBeninBermudaBhutanBoliviaBosnia and HerzegovinaBotswanaBrazilBritish Virgin IslandsBrunei DarussalamBulgariaBurkina FasoBurundiCabo VerdeCambodiaCameroonCanadaCaribbean small statesCentral African RepublicCentral Europe and the BalticsChadChileChinaColombiaComorosCongo, Dem. Rep.Congo, Rep.Costa RicaCote d'IvoireCroatiaCubaCuracaoCyprusCzech RepublicDenmarkDjiboutiDominicaDominican RepublicEarly-demographic dividendEast Asia & PacificEast Asia & Pacific (excluding high income)East Asia & Pacific (IDA & IBRD countries)EcuadorEgypt, Arab Rep.El SalvadorEquatorial GuineaEritreaEstoniaEthiopiaEuro areaEurope & Central AsiaEurope & Central Asia (excluding high income)Europe & Central Asia (IDA & IBRD countries)European UnionFijiFinlandFragile and conflict affected situationsFranceGabonGambia, TheGeorgiaGermanyGhanaGreeceGrenadaGuatemalaGuineaGuinea-BissauGuyanaHaitiHeavily indebted poor countries (HIPC)High incomeHondurasHong Kong SAR, ChinaHungaryIBRD onlyIcelandIDA & IBRD totalIDA blendIDA onlyIDA totalIndiaIndonesiaIran, Islamic Rep.IraqIrelandIsraelItalyJamaicaJapanJordanKazakhstanKenyaKorea, Dem. People’s Rep.Korea, Rep.KuwaitKyrgyz RepublicLao PDRLate-demographic dividendLatin America & Caribbean Latin America & Caribbean (excluding high income)Latin America & the Caribbean (IDA & IBRD countries)LatviaLeast developed countries: UN classificationLebanonLesothoLiberiaLibyaLiechtensteinLithuaniaLow & middle incomeLow incomeLower middle incomeLuxembourgMacao SAR, ChinaMacedonia, FYRMadagascarMalawiMalaysiaMaldivesMaliMaltaMarshall IslandsMauritaniaMauritiusMexicoMicronesia, Fed. Sts.Middle East & North AfricaMiddle East & North Africa (excluding high income)Middle East & North Africa (IDA & IBRD countries)Middle incomeMoldovaMongoliaMontenegroMoroccoMozambiqueMyanmarNamibiaNepalNetherlandsNew ZealandNicaraguaNigerNigeriaNorth AmericaNorwayOECD membersOmanOther small statesPacific island small statesPakistanPalauPanamaPapua New GuineaParaguayPeruPhilippinesPolandPortugalPost-demographic dividendPre-demographic dividendPuerto RicoQatarRomaniaRussian FederationRwandaSamoaSan MarinoSao Tome and PrincipeSaudi ArabiaSenegalSerbiaSeychellesSierra LeoneSingaporeSlovak RepublicSloveniaSmall statesSomaliaSouth AfricaSouth AsiaSouth Asia (IDA & IBRD)SpainSri LankaSt. Kitts and NevisSt. LuciaSt. Vincent and the GrenadinesSub-Saharan Africa Sub-Saharan Africa (excluding high income)Sub-Saharan Africa (IDA & IBRD countries)SudanSurinameSwazilandSwedenSwitzerlandSyrian Arab RepublicTajikistanTanzaniaThailandTimor-LesteTogoTongaTrinidad and TobagoTunisiaTurkeyTurkmenistanUgandaUkraineUnited Arab EmiratesUnited KingdomUnited StatesUpper middle incomeUruguayUzbekistanVanuatuVenezuela, RBVietnamWest Bank and GazaWorldYemen, Rep.ZambiaZimbabwe Timeline:
This timeline shows a graph from 1972 to 2015 of Austria. No data until 1971. Number of actual observations by date: 44.
Source name:
World Development Indicators
Source organization:
UNESCO Institute for Statistics
Categories, topics:
Education
Last updated:
apr 23, 2017
Indicators value changes by year
Minimum:
12.211
jan 1, 1972
Maximum:
80.387
jan 1, 2014
At the date of observation
Value
Absolute change
Change from previous value
jan 1, 1972
12.211
+12.211
0.0%
jan 1, 1973
13.692
+1.481
12.13%
jan 1, 1974
15.14
+1.448
10.57%
jan 1, 1975
16.029
+0.89
5.88%
jan 1, 1976
16.71
+0.681
4.25%
jan 1, 1977
18.581
+1.871
11.2%
jan 1, 1978
19.314
+0.733
3.95%
jan 1, 1979
19.751
+0.437
2.26%
jan 1, 1980
20.453
+0.702
3.56%
jan 1, 1981
21.393
+0.939
4.59%
jan 1, 1982
22.329
+0.937
4.38%
jan 1, 1983
22.495
+0.166
0.74%
jan 1, 1984
23.021
+0.526
2.34%
jan 1, 1985
23.978
+0.956
4.15%
jan 1, 1986
25.561
+1.583
6.6%
jan 1, 1987
26.74
+1.179
4.61%
jan 1, 1988
27.851
+1.111
4.16%
jan 1, 1989
29.403
+1.552
5.57%
jan 1, 1990
30.621
+1.217
4.14%
jan 1, 1991
32.572
+1.952
6.37%
jan 1, 1992
34.735
+2.163
6.64%
jan 1, 1993
37.661
+2.925
8.42%
jan 1, 1994
39.826
+2.166
5.75%
jan 1, 1995
42.327
+2.501
6.28%
jan 1, 1996
45.046
+2.718
6.42%
jan 1, 1997
47.566
+2.521
5.6%
jan 1, 1998
49.647
+2.081
4.37%
jan 1, 1999
52.483
+2.836
5.71%
jan 1, 2000
54.518
+2.034
3.88%
jan 1, 2001
56.573
+2.055
3.77%
jan 1, 2002
56.806
+0.233
0.41%
jan 1, 2003
46.535
-10.271
-18.08%
jan 1, 2004
46.424
-0.112
-0.24%
jan 1, 2005
47.2
+0.777
1.67%
jan 1, 2006
47.782
+0.582
1.23%
jan 1, 2007
49.413
+1.631
3.41%
jan 1, 2008
51.229
+1.815
3.67%
jan 1, 2009
56.15
+4.921
9.61%
jan 1, 2010
60.717
+4.567
8.13%
jan 1, 2011
68.732
+8.016
13.2%
jan 1, 2012
71.011
+2.279
3.32%
jan 1, 2013
72.315
+1.304
1.84%
jan 1, 2014
80.387
+8.072
11.16%
jan 1, 2015
79.999
-0.388
-0.48%
Ranking of countries by current statistics by years


Comments: