29
/
en
AIzaSyAYiBZKx7MnpbEhh9jyipgxe19OcubqV5w
April 1, 2024
266897
Trinidad and Tobago
TTO
true
2
1
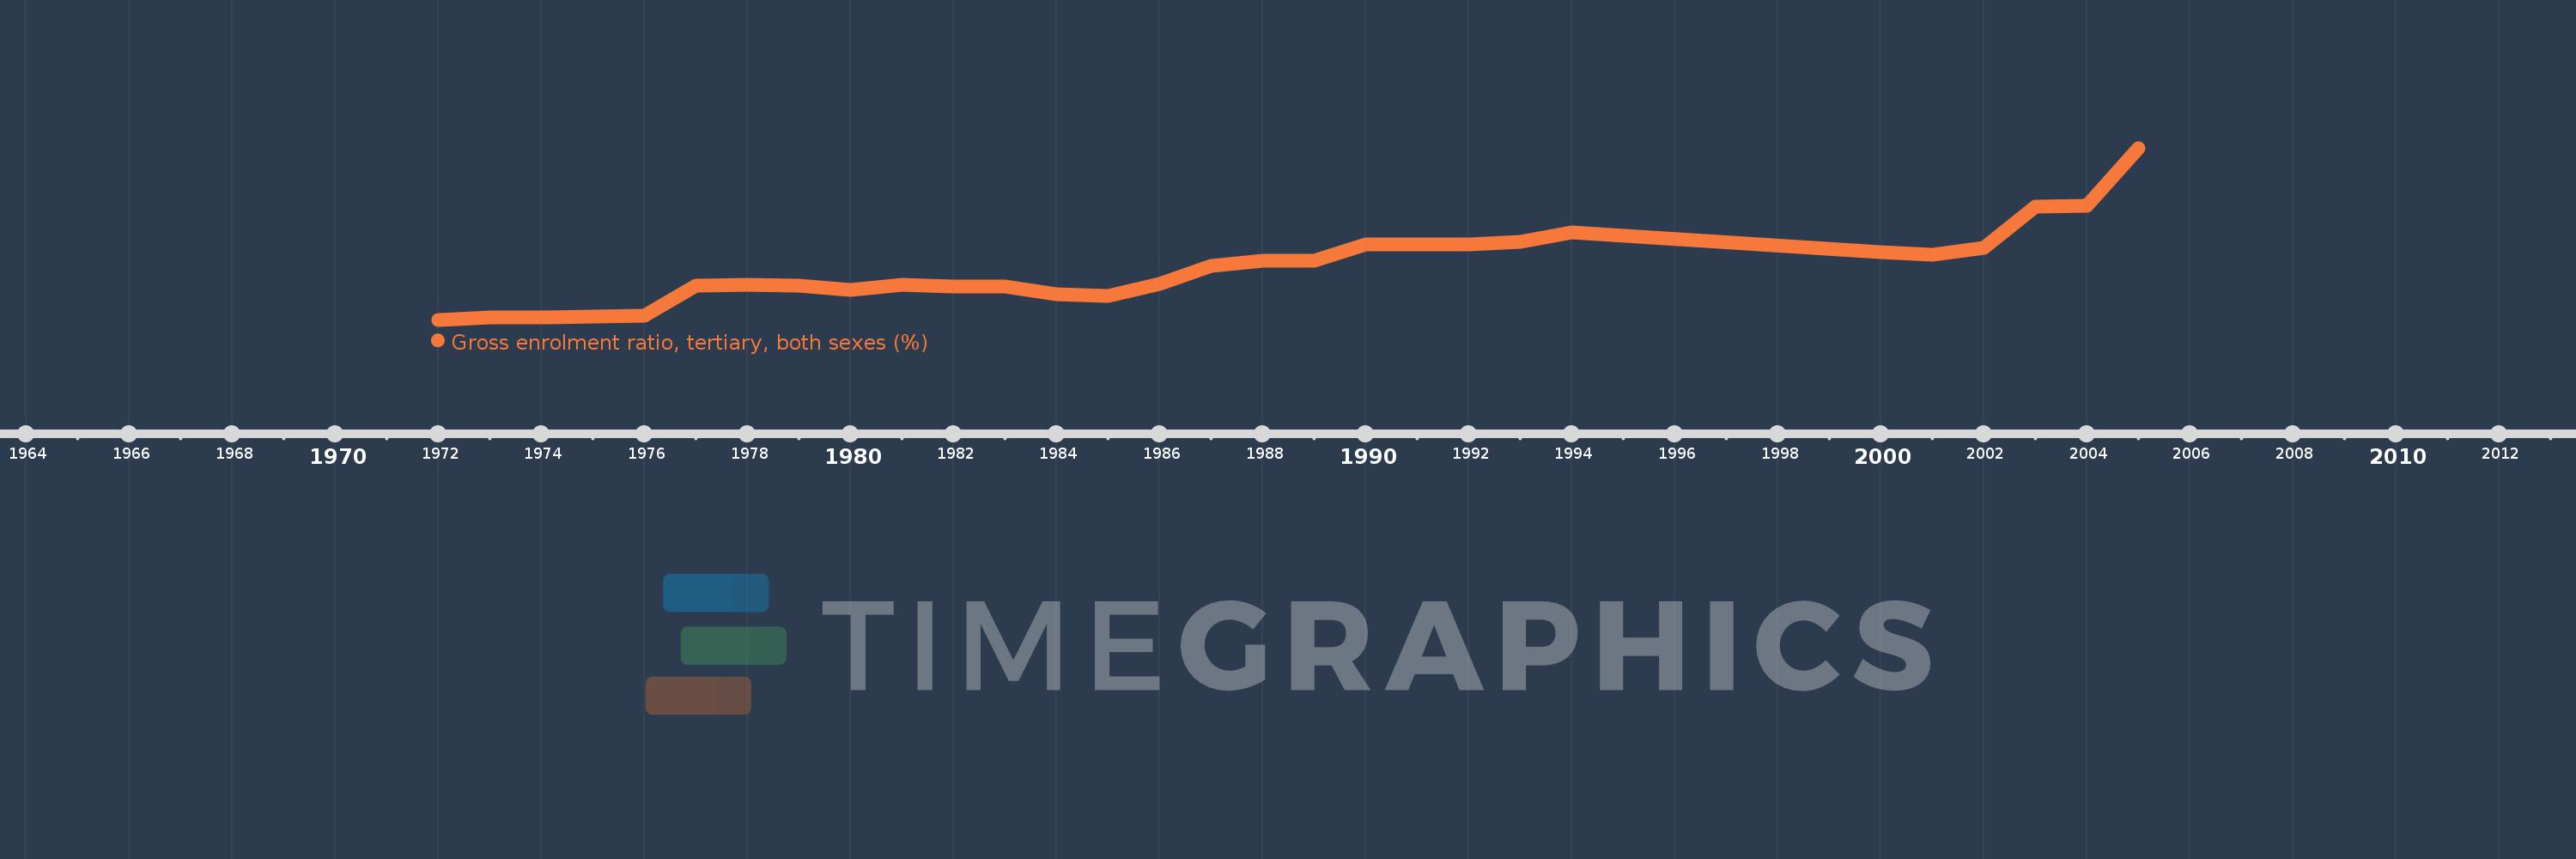
Gross enrolment ratio, tertiary, both sexes (%)
2005,2004,2003,2002,2001,2000,1994,1993,1992,1990,1989,1988,1987,1986,1985,1984,1983,1982,1981,1980,1979,1978,1977,1976,1975,1974,1973,1972
This statistics in other country:
AfghanistanAlbaniaAlgeriaAngolaAntigua and BarbudaArab WorldArgentinaArmeniaArubaAustraliaAustriaAzerbaijanBahamas, TheBahrainBangladeshBarbadosBelarusBelgiumBelizeBeninBermudaBhutanBoliviaBosnia and HerzegovinaBotswanaBrazilBritish Virgin IslandsBrunei DarussalamBulgariaBurkina FasoBurundiCabo VerdeCambodiaCameroonCanadaCaribbean small statesCentral African RepublicCentral Europe and the BalticsChadChileChinaColombiaComorosCongo, Dem. Rep.Congo, Rep.Costa RicaCote d'IvoireCroatiaCubaCuracaoCyprusCzech RepublicDenmarkDjiboutiDominicaDominican RepublicEarly-demographic dividendEast Asia & PacificEast Asia & Pacific (excluding high income)East Asia & Pacific (IDA & IBRD countries)EcuadorEgypt, Arab Rep.El SalvadorEquatorial GuineaEritreaEstoniaEthiopiaEuro areaEurope & Central AsiaEurope & Central Asia (excluding high income)Europe & Central Asia (IDA & IBRD countries)European UnionFijiFinlandFragile and conflict affected situationsFranceGabonGambia, TheGeorgiaGermanyGhanaGreeceGrenadaGuatemalaGuineaGuinea-BissauGuyanaHaitiHeavily indebted poor countries (HIPC)High incomeHondurasHong Kong SAR, ChinaHungaryIBRD onlyIcelandIDA & IBRD totalIDA blendIDA onlyIDA totalIndiaIndonesiaIran, Islamic Rep.IraqIrelandIsraelItalyJamaicaJapanJordanKazakhstanKenyaKorea, Dem. People’s Rep.Korea, Rep.KuwaitKyrgyz RepublicLao PDRLate-demographic dividendLatin America & Caribbean Latin America & Caribbean (excluding high income)Latin America & the Caribbean (IDA & IBRD countries)LatviaLeast developed countries: UN classificationLebanonLesothoLiberiaLibyaLiechtensteinLithuaniaLow & middle incomeLow incomeLower middle incomeLuxembourgMacao SAR, ChinaMacedonia, FYRMadagascarMalawiMalaysiaMaldivesMaliMaltaMarshall IslandsMauritaniaMauritiusMexicoMicronesia, Fed. Sts.Middle East & North AfricaMiddle East & North Africa (excluding high income)Middle East & North Africa (IDA & IBRD countries)Middle incomeMoldovaMongoliaMontenegroMoroccoMozambiqueMyanmarNamibiaNepalNetherlandsNew ZealandNicaraguaNigerNigeriaNorth AmericaNorwayOECD membersOmanOther small statesPacific island small statesPakistanPalauPanamaPapua New GuineaParaguayPeruPhilippinesPolandPortugalPost-demographic dividendPre-demographic dividendPuerto RicoQatarRomaniaRussian FederationRwandaSamoaSan MarinoSao Tome and PrincipeSaudi ArabiaSenegalSerbiaSeychellesSierra LeoneSingaporeSlovak RepublicSloveniaSmall statesSomaliaSouth AfricaSouth AsiaSouth Asia (IDA & IBRD)SpainSri LankaSt. Kitts and NevisSt. LuciaSt. Vincent and the GrenadinesSub-Saharan Africa Sub-Saharan Africa (excluding high income)Sub-Saharan Africa (IDA & IBRD countries)SudanSurinameSwazilandSwedenSwitzerlandSyrian Arab RepublicTajikistanTanzaniaThailandTimor-LesteTogoTongaTrinidad and TobagoTunisiaTurkeyTurkmenistanUgandaUkraineUnited Arab EmiratesUnited KingdomUnited StatesUpper middle incomeUruguayUzbekistanVanuatuVenezuela, RBVietnamWest Bank and GazaWorldYemen, Rep.ZambiaZimbabwe Timeline:
This timeline shows a graph from 1972 to 2005 of Trinidad and Tobago. No data until 1971. Number of actual observations by date: 28.
Source name:
World Development Indicators
Source organization:
UNESCO Institute for Statistics
Categories, topics:
Education
Last updated:
apr 23, 2017
Indicators value changes by year
Maximum:
11.951
jan 1, 2005
At the date of observation
Value
Absolute change
Change from previous value
jan 1, 1972
2.469
+2.469
0.0%
jan 1, 1973
2.598
+0.129
5.21%
jan 1, 1974
2.611
+0.013
0.48%
jan 1, 1975
2.645
+0.034
1.3%
jan 1, 1976
2.69
+0.046
1.73%
jan 1, 1977
4.362
+1.672
62.15%
jan 1, 1978
4.413
+0.05
1.15%
jan 1, 1979
4.37
-0.043
-0.96%
jan 1, 1980
4.136
-0.234
-5.36%
jan 1, 1981
4.421
+0.285
6.89%
jan 1, 1982
4.298
-0.123
-2.78%
jan 1, 1983
4.31
+0.012
0.27%
jan 1, 1984
3.899
-0.411
-9.54%
jan 1, 1985
3.776
-0.123
-3.16%
jan 1, 1986
4.459
+0.683
18.08%
jan 1, 1987
5.431
+0.972
21.81%
jan 1, 1988
5.73
+0.299
5.51%
jan 1, 1989
5.736
+0.006
0.11%
jan 1, 1990
6.645
+0.909
15.84%
jan 1, 1992
6.615
-0.03
-0.46%
jan 1, 1993
6.759
+0.144
2.18%
jan 1, 1994
7.283
+0.525
7.76%
jan 1, 2000
6.202
-1.082
-14.85%
jan 1, 2001
6.06
-0.141
-2.28%
jan 1, 2002
6.436
+0.375
6.19%
jan 1, 2003
8.703
+2.267
35.23%
jan 1, 2004
8.777
+0.074
0.85%
jan 1, 2005
11.951
+3.174
36.16%
Ranking of countries by current statistics by years


Comments: