29
/
en
AIzaSyAYiBZKx7MnpbEhh9jyipgxe19OcubqV5w
April 1, 2024
61651
Upper middle income
UMC
false
2
1
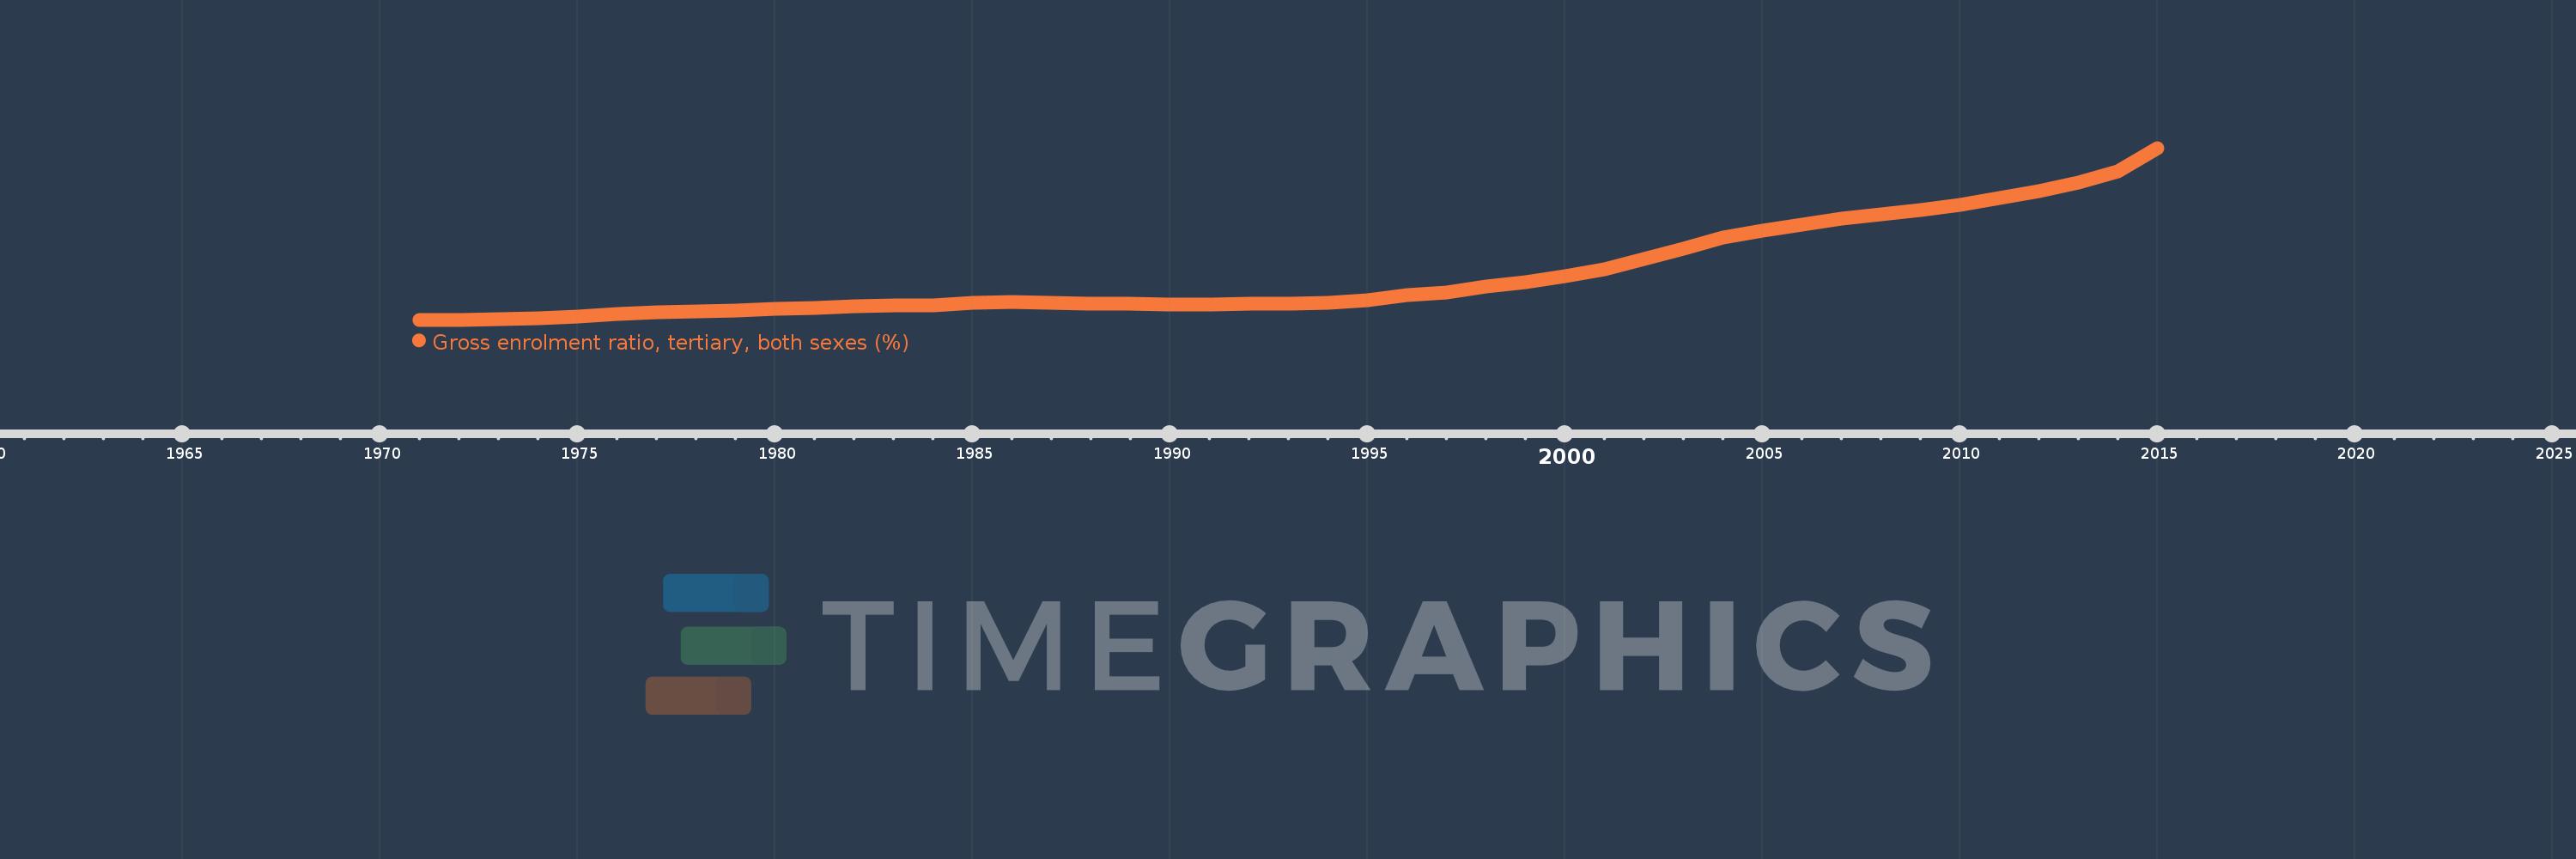
Gross enrolment ratio, tertiary, both sexes (%)
2015,2014,2013,2012,2011,2010,2009,2008,2007,2006,2005,2004,2003,2002,2001,2000,1999,1998,1997,1996,1995,1994,1993,1992,1991,1990,1989,1988,1987,1986,1985,1984,1983,1982,1981,1980,1979,1978,1977,1976,1975,1974,1973,1972,1971
This statistics in other country:
AfghanistanAlbaniaAlgeriaAngolaAntigua and BarbudaArab WorldArgentinaArmeniaArubaAustraliaAustriaAzerbaijanBahamas, TheBahrainBangladeshBarbadosBelarusBelgiumBelizeBeninBermudaBhutanBoliviaBosnia and HerzegovinaBotswanaBrazilBritish Virgin IslandsBrunei DarussalamBulgariaBurkina FasoBurundiCabo VerdeCambodiaCameroonCanadaCaribbean small statesCentral African RepublicCentral Europe and the BalticsChadChileChinaColombiaComorosCongo, Dem. Rep.Congo, Rep.Costa RicaCote d'IvoireCroatiaCubaCuracaoCyprusCzech RepublicDenmarkDjiboutiDominicaDominican RepublicEarly-demographic dividendEast Asia & PacificEast Asia & Pacific (excluding high income)East Asia & Pacific (IDA & IBRD countries)EcuadorEgypt, Arab Rep.El SalvadorEquatorial GuineaEritreaEstoniaEthiopiaEuro areaEurope & Central AsiaEurope & Central Asia (excluding high income)Europe & Central Asia (IDA & IBRD countries)European UnionFijiFinlandFragile and conflict affected situationsFranceGabonGambia, TheGeorgiaGermanyGhanaGreeceGrenadaGuatemalaGuineaGuinea-BissauGuyanaHaitiHeavily indebted poor countries (HIPC)High incomeHondurasHong Kong SAR, ChinaHungaryIBRD onlyIcelandIDA & IBRD totalIDA blendIDA onlyIDA totalIndiaIndonesiaIran, Islamic Rep.IraqIrelandIsraelItalyJamaicaJapanJordanKazakhstanKenyaKorea, Dem. People’s Rep.Korea, Rep.KuwaitKyrgyz RepublicLao PDRLate-demographic dividendLatin America & Caribbean Latin America & Caribbean (excluding high income)Latin America & the Caribbean (IDA & IBRD countries)LatviaLeast developed countries: UN classificationLebanonLesothoLiberiaLibyaLiechtensteinLithuaniaLow & middle incomeLow incomeLower middle incomeLuxembourgMacao SAR, ChinaMacedonia, FYRMadagascarMalawiMalaysiaMaldivesMaliMaltaMarshall IslandsMauritaniaMauritiusMexicoMicronesia, Fed. Sts.Middle East & North AfricaMiddle East & North Africa (excluding high income)Middle East & North Africa (IDA & IBRD countries)Middle incomeMoldovaMongoliaMontenegroMoroccoMozambiqueMyanmarNamibiaNepalNetherlandsNew ZealandNicaraguaNigerNigeriaNorth AmericaNorwayOECD membersOmanOther small statesPacific island small statesPakistanPalauPanamaPapua New GuineaParaguayPeruPhilippinesPolandPortugalPost-demographic dividendPre-demographic dividendPuerto RicoQatarRomaniaRussian FederationRwandaSamoaSan MarinoSao Tome and PrincipeSaudi ArabiaSenegalSerbiaSeychellesSierra LeoneSingaporeSlovak RepublicSloveniaSmall statesSomaliaSouth AfricaSouth AsiaSouth Asia (IDA & IBRD)SpainSri LankaSt. Kitts and NevisSt. LuciaSt. Vincent and the GrenadinesSub-Saharan Africa Sub-Saharan Africa (excluding high income)Sub-Saharan Africa (IDA & IBRD countries)SudanSurinameSwazilandSwedenSwitzerlandSyrian Arab RepublicTajikistanTanzaniaThailandTimor-LesteTogoTongaTrinidad and TobagoTunisiaTurkeyTurkmenistanUgandaUkraineUnited Arab EmiratesUnited KingdomUnited StatesUpper middle incomeUruguayUzbekistanVanuatuVenezuela, RBVietnamWest Bank and GazaWorldYemen, Rep.ZambiaZimbabwe Timeline:
This timeline shows a graph from 1971 to 2015 of Upper middle income. No data until 1970. Number of actual observations by date: 45.
Source name:
World Development Indicators
Source organization:
UNESCO Institute for Statistics
Categories, topics:
Education
Last updated:
apr 23, 2017
Indicators value changes by year
Maximum:
43.853
jan 1, 2015
At the date of observation
Value
Absolute change
Change from previous value
jan 1, 1971
6.413
+6.413
0.0%
jan 1, 1972
6.401
-0.012
-0.18%
jan 1, 1973
6.486
+0.084
1.32%
jan 1, 1974
6.686
+0.2
3.09%
jan 1, 1975
7.104
+0.418
6.25%
jan 1, 1976
7.676
+0.572
8.06%
jan 1, 1977
8.012
+0.336
4.37%
jan 1, 1978
8.239
+0.227
2.83%
jan 1, 1979
8.452
+0.213
2.58%
jan 1, 1980
8.835
+0.383
4.53%
jan 1, 1981
9.014
+0.18
2.03%
jan 1, 1982
9.268
+0.254
2.82%
jan 1, 1983
9.524
+0.256
2.76%
jan 1, 1984
9.542
+0.018
0.19%
jan 1, 1985
10.003
+0.461
4.83%
jan 1, 1986
10.224
+0.221
2.21%
jan 1, 1987
10.054
-0.17
-1.66%
jan 1, 1988
9.984
-0.07
-0.7%
jan 1, 1989
9.855
-0.129
-1.29%
jan 1, 1990
9.773
-0.082
-0.83%
jan 1, 1991
9.798
+0.025
0.25%
jan 1, 1992
9.898
+0.1
1.03%
jan 1, 1993
9.898
0.0
0.0%
jan 1, 1994
10.017
+0.118
1.2%
jan 1, 1995
10.677
+0.66
6.59%
jan 1, 1996
11.733
+1.056
9.89%
jan 1, 1997
12.339
+0.606
5.16%
jan 1, 1998
13.654
+1.315
10.65%
jan 1, 1999
14.492
+0.838
6.14%
jan 1, 2000
15.928
+1.436
9.91%
jan 1, 2001
17.311
+1.383
8.68%
jan 1, 2002
19.578
+2.267
13.1%
jan 1, 2003
21.937
+2.359
12.05%
jan 1, 2004
24.296
+2.359
10.75%
jan 1, 2005
25.819
+1.524
6.27%
jan 1, 2006
27.122
+1.302
5.04%
jan 1, 2007
28.373
+1.252
4.61%
jan 1, 2008
29.294
+0.921
3.25%
jan 1, 2009
30.266
+0.971
3.32%
jan 1, 2010
31.515
+1.249
4.13%
jan 1, 2011
32.972
+1.458
4.63%
jan 1, 2012
34.376
+1.403
4.26%
jan 1, 2013
36.382
+2.006
5.84%
jan 1, 2014
38.768
+2.386
6.56%
jan 1, 2015
43.853
+5.085
13.12%
Ranking of countries by current statistics by years


Comments: