29
/
en
AIzaSyAYiBZKx7MnpbEhh9jyipgxe19OcubqV5w
April 1, 2024
169966
Korea, Rep.
KOR
true
2
1
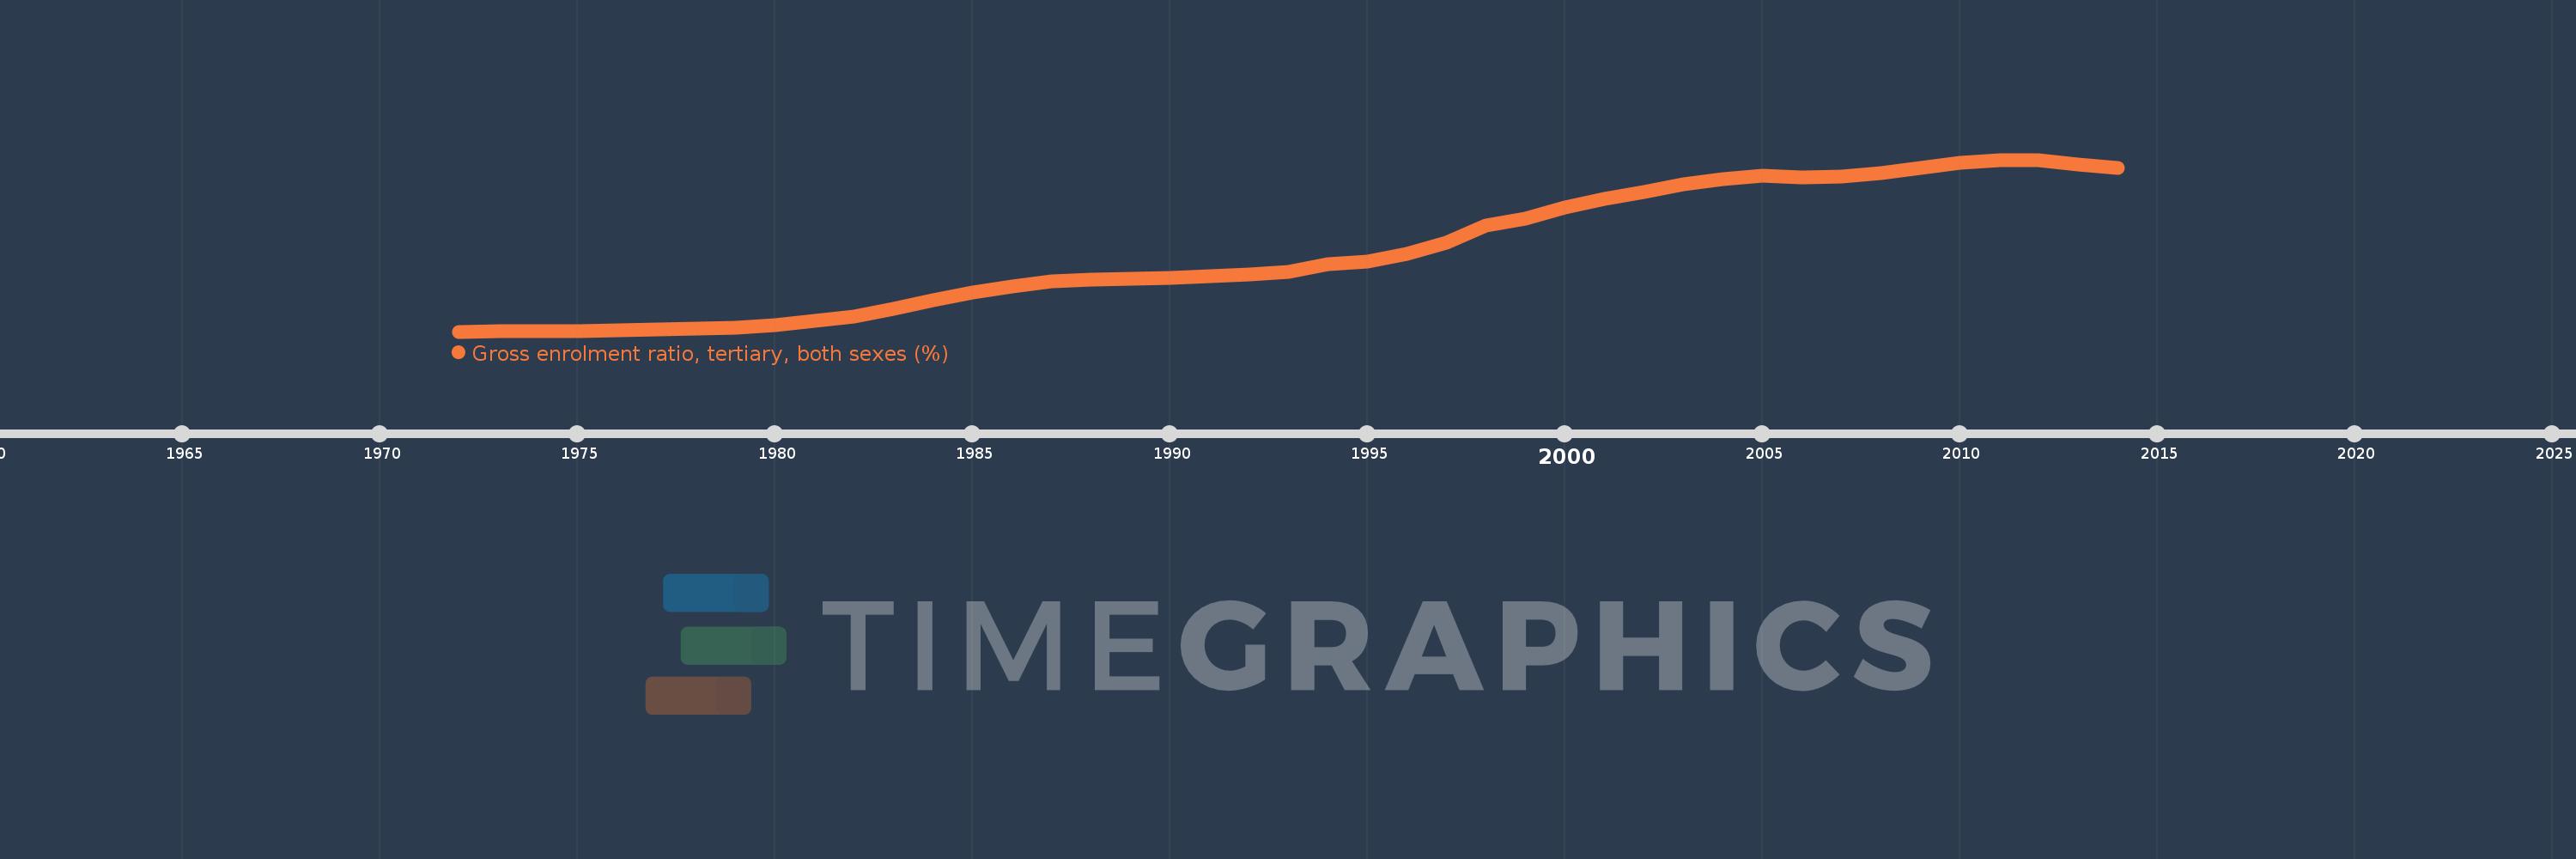
Gross enrolment ratio, tertiary, both sexes (%)
2014,2013,2012,2011,2010,2009,2008,2007,2006,2005,2004,2003,2002,2001,2000,1999,1998,1997,1996,1995,1994,1993,1992,1991,1990,1989,1988,1987,1986,1985,1984,1983,1982,1981,1980,1979,1978,1977,1976,1975,1974,1973,1972
This statistics in other country:
AfghanistanAlbaniaAlgeriaAngolaAntigua and BarbudaArab WorldArgentinaArmeniaArubaAustraliaAustriaAzerbaijanBahamas, TheBahrainBangladeshBarbadosBelarusBelgiumBelizeBeninBermudaBhutanBoliviaBosnia and HerzegovinaBotswanaBrazilBritish Virgin IslandsBrunei DarussalamBulgariaBurkina FasoBurundiCabo VerdeCambodiaCameroonCanadaCaribbean small statesCentral African RepublicCentral Europe and the BalticsChadChileChinaColombiaComorosCongo, Dem. Rep.Congo, Rep.Costa RicaCote d'IvoireCroatiaCubaCuracaoCyprusCzech RepublicDenmarkDjiboutiDominicaDominican RepublicEarly-demographic dividendEast Asia & PacificEast Asia & Pacific (excluding high income)East Asia & Pacific (IDA & IBRD countries)EcuadorEgypt, Arab Rep.El SalvadorEquatorial GuineaEritreaEstoniaEthiopiaEuro areaEurope & Central AsiaEurope & Central Asia (excluding high income)Europe & Central Asia (IDA & IBRD countries)European UnionFijiFinlandFragile and conflict affected situationsFranceGabonGambia, TheGeorgiaGermanyGhanaGreeceGrenadaGuatemalaGuineaGuinea-BissauGuyanaHaitiHeavily indebted poor countries (HIPC)High incomeHondurasHong Kong SAR, ChinaHungaryIBRD onlyIcelandIDA & IBRD totalIDA blendIDA onlyIDA totalIndiaIndonesiaIran, Islamic Rep.IraqIrelandIsraelItalyJamaicaJapanJordanKazakhstanKenyaKorea, Dem. People’s Rep.Korea, Rep.KuwaitKyrgyz RepublicLao PDRLate-demographic dividendLatin America & Caribbean Latin America & Caribbean (excluding high income)Latin America & the Caribbean (IDA & IBRD countries)LatviaLeast developed countries: UN classificationLebanonLesothoLiberiaLibyaLiechtensteinLithuaniaLow & middle incomeLow incomeLower middle incomeLuxembourgMacao SAR, ChinaMacedonia, FYRMadagascarMalawiMalaysiaMaldivesMaliMaltaMarshall IslandsMauritaniaMauritiusMexicoMicronesia, Fed. Sts.Middle East & North AfricaMiddle East & North Africa (excluding high income)Middle East & North Africa (IDA & IBRD countries)Middle incomeMoldovaMongoliaMontenegroMoroccoMozambiqueMyanmarNamibiaNepalNetherlandsNew ZealandNicaraguaNigerNigeriaNorth AmericaNorwayOECD membersOmanOther small statesPacific island small statesPakistanPalauPanamaPapua New GuineaParaguayPeruPhilippinesPolandPortugalPost-demographic dividendPre-demographic dividendPuerto RicoQatarRomaniaRussian FederationRwandaSamoaSan MarinoSao Tome and PrincipeSaudi ArabiaSenegalSerbiaSeychellesSierra LeoneSingaporeSlovak RepublicSloveniaSmall statesSomaliaSouth AfricaSouth AsiaSouth Asia (IDA & IBRD)SpainSri LankaSt. Kitts and NevisSt. LuciaSt. Vincent and the GrenadinesSub-Saharan Africa Sub-Saharan Africa (excluding high income)Sub-Saharan Africa (IDA & IBRD countries)SudanSurinameSwazilandSwedenSwitzerlandSyrian Arab RepublicTajikistanTanzaniaThailandTimor-LesteTogoTongaTrinidad and TobagoTunisiaTurkeyTurkmenistanUgandaUkraineUnited Arab EmiratesUnited KingdomUnited StatesUpper middle incomeUruguayUzbekistanVanuatuVenezuela, RBVietnamWest Bank and GazaWorldYemen, Rep.ZambiaZimbabwe Timeline:
This timeline shows a graph from 1972 to 2014 of Korea, Rep.. No data until 1971. Number of actual observations by date: 43.
Source name:
World Development Indicators
Source organization:
UNESCO Institute for Statistics
Categories, topics:
Education
Last updated:
apr 23, 2017
Indicators value changes by year
At the date of observation
Value
Absolute change
Change from previous value
jan 1, 1972
7.246
+7.246
0.0%
jan 1, 1973
7.344
+0.098
1.35%
jan 1, 1974
7.407
+0.063
0.86%
jan 1, 1975
7.539
+0.132
1.78%
jan 1, 1976
7.732
+0.193
2.57%
jan 1, 1977
8.492
+0.759
9.82%
jan 1, 1978
8.758
+0.266
3.13%
jan 1, 1979
9.425
+0.668
7.63%
jan 1, 1980
10.622
+1.197
12.7%
jan 1, 1981
12.83
+2.208
20.79%
jan 1, 1982
15.343
+2.513
19.59%
jan 1, 1983
19.625
+4.281
27.9%
jan 1, 1984
24.255
+4.63
23.59%
jan 1, 1985
28.304
+4.049
16.69%
jan 1, 1986
31.585
+3.281
11.59%
jan 1, 1987
34.1
+2.515
7.96%
jan 1, 1988
35.246
+1.146
3.36%
jan 1, 1989
35.701
+0.454
1.29%
jan 1, 1990
35.921
+0.22
0.62%
jan 1, 1991
36.875
+0.954
2.66%
jan 1, 1992
37.934
+1.059
2.87%
jan 1, 1993
39.505
+1.571
4.14%
jan 1, 1994
43.304
+3.8
9.62%
jan 1, 1995
44.978
+1.673
3.86%
jan 1, 1996
48.928
+3.95
8.78%
jan 1, 1997
54.847
+5.919
12.1%
jan 1, 1998
64.509
+9.662
17.62%
jan 1, 1999
68.043
+3.533
5.48%
jan 1, 2000
73.902
+5.86
8.61%
jan 1, 2001
78.436
+4.534
6.14%
jan 1, 2002
82.47
+4.034
5.14%
jan 1, 2003
86.491
+4.021
4.88%
jan 1, 2004
89.263
+2.772
3.2%
jan 1, 2005
91.023
+1.761
1.97%
jan 1, 2006
90.296
-0.727
-0.8%
jan 1, 2007
90.462
+0.165
0.18%
jan 1, 2008
92.577
+2.115
2.34%
jan 1, 2009
95.256
+2.679
2.89%
jan 1, 2010
97.972
+2.716
2.85%
jan 1, 2011
99.66
+1.689
1.72%
jan 1, 2012
99.519
-0.141
-0.14%
jan 1, 2013
97.117
-2.402
-2.41%
jan 1, 2014
95.345
-1.772
-1.82%
Ranking of countries by current statistics by years


Comments: