29
/
en
AIzaSyAYiBZKx7MnpbEhh9jyipgxe19OcubqV5w
April 1, 2024
147996
Guyana
GUY
true
2
1
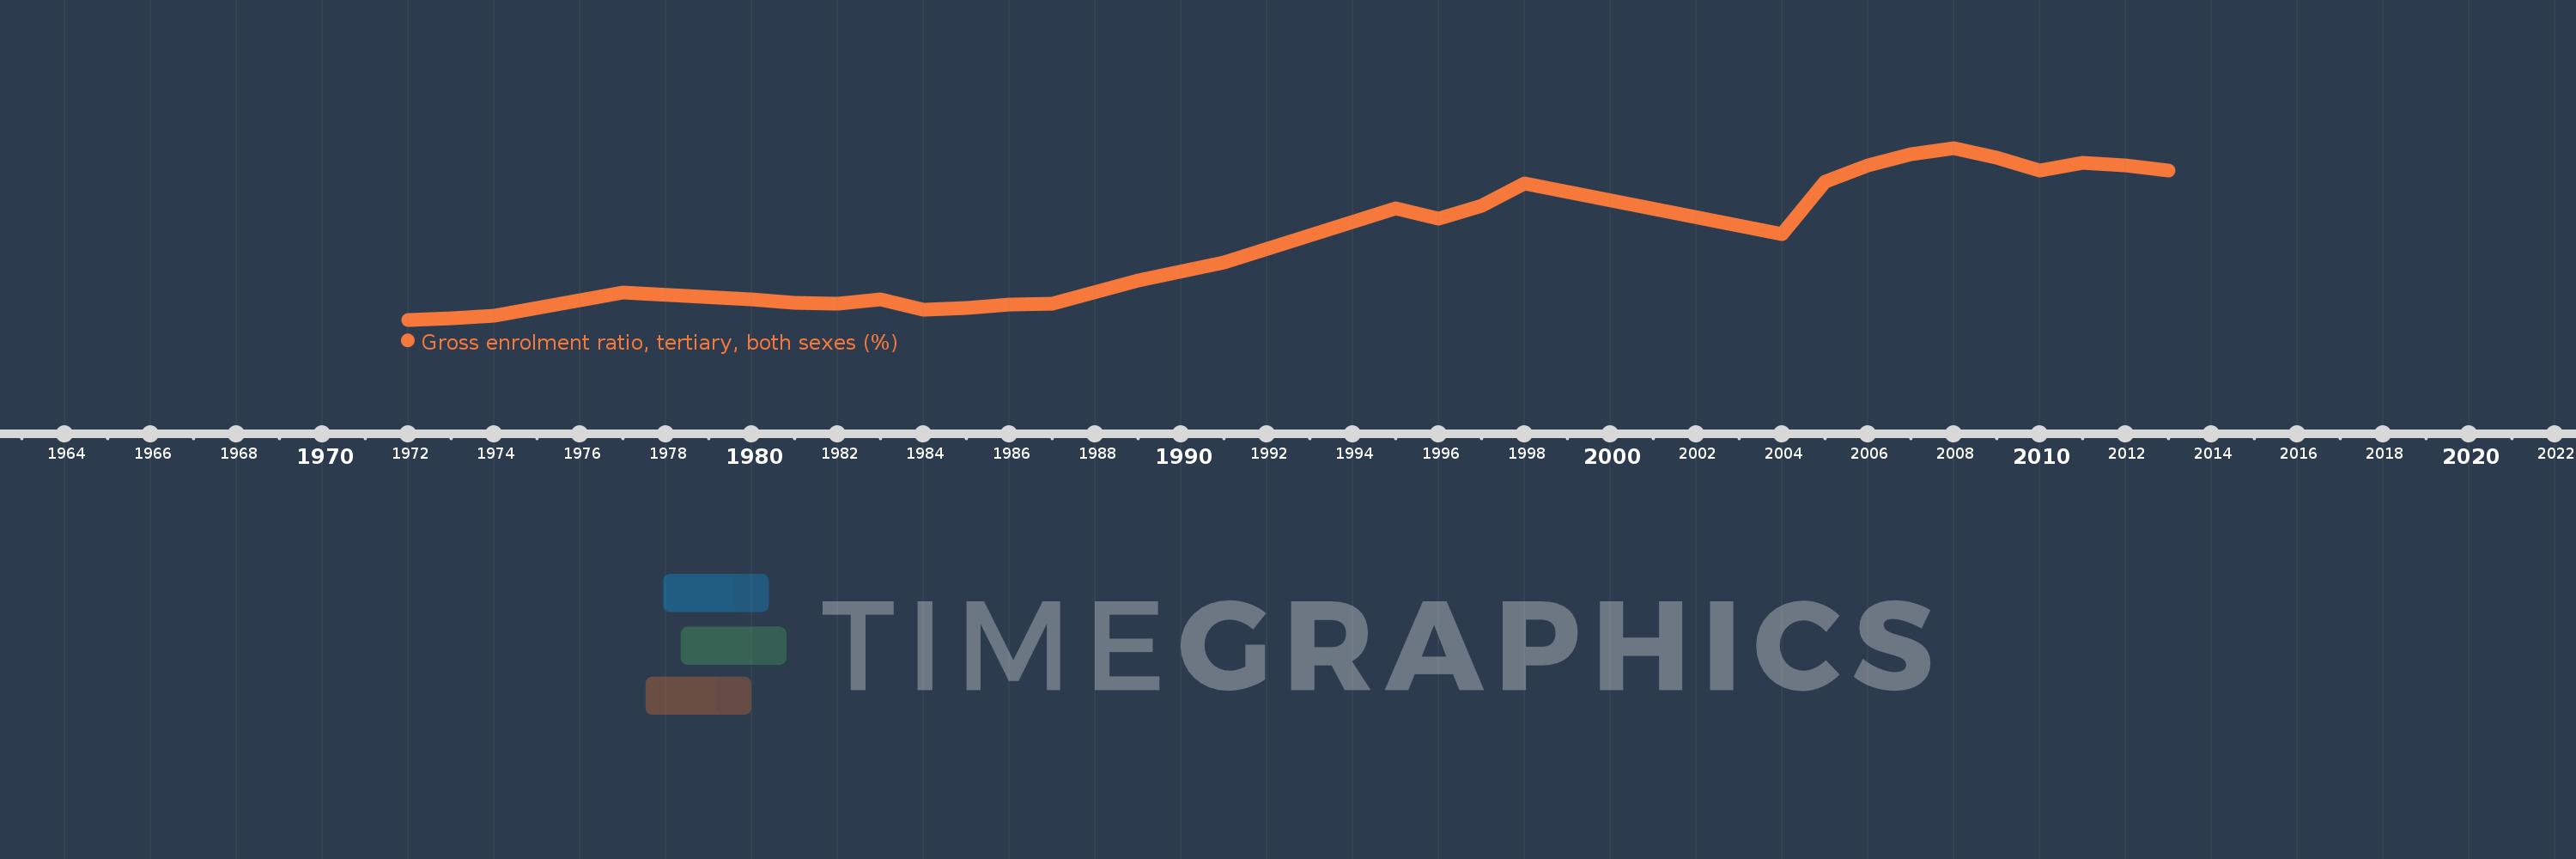
Gross enrolment ratio, tertiary, both sexes (%)
2013,2012,2011,2010,2009,2008,2007,2006,2005,2004,1998,1997,1996,1995,1991,1989,1987,1986,1985,1984,1983,1982,1981,1980,1977,1974,1973,1972
This statistics in other country:
AfghanistanAlbaniaAlgeriaAngolaAntigua and BarbudaArab WorldArgentinaArmeniaArubaAustraliaAustriaAzerbaijanBahamas, TheBahrainBangladeshBarbadosBelarusBelgiumBelizeBeninBermudaBhutanBoliviaBosnia and HerzegovinaBotswanaBrazilBritish Virgin IslandsBrunei DarussalamBulgariaBurkina FasoBurundiCabo VerdeCambodiaCameroonCanadaCaribbean small statesCentral African RepublicCentral Europe and the BalticsChadChileChinaColombiaComorosCongo, Dem. Rep.Congo, Rep.Costa RicaCote d'IvoireCroatiaCubaCuracaoCyprusCzech RepublicDenmarkDjiboutiDominicaDominican RepublicEarly-demographic dividendEast Asia & PacificEast Asia & Pacific (excluding high income)East Asia & Pacific (IDA & IBRD countries)EcuadorEgypt, Arab Rep.El SalvadorEquatorial GuineaEritreaEstoniaEthiopiaEuro areaEurope & Central AsiaEurope & Central Asia (excluding high income)Europe & Central Asia (IDA & IBRD countries)European UnionFijiFinlandFragile and conflict affected situationsFranceGabonGambia, TheGeorgiaGermanyGhanaGreeceGrenadaGuatemalaGuineaGuinea-BissauGuyanaHaitiHeavily indebted poor countries (HIPC)High incomeHondurasHong Kong SAR, ChinaHungaryIBRD onlyIcelandIDA & IBRD totalIDA blendIDA onlyIDA totalIndiaIndonesiaIran, Islamic Rep.IraqIrelandIsraelItalyJamaicaJapanJordanKazakhstanKenyaKorea, Dem. People’s Rep.Korea, Rep.KuwaitKyrgyz RepublicLao PDRLate-demographic dividendLatin America & Caribbean Latin America & Caribbean (excluding high income)Latin America & the Caribbean (IDA & IBRD countries)LatviaLeast developed countries: UN classificationLebanonLesothoLiberiaLibyaLiechtensteinLithuaniaLow & middle incomeLow incomeLower middle incomeLuxembourgMacao SAR, ChinaMacedonia, FYRMadagascarMalawiMalaysiaMaldivesMaliMaltaMarshall IslandsMauritaniaMauritiusMexicoMicronesia, Fed. Sts.Middle East & North AfricaMiddle East & North Africa (excluding high income)Middle East & North Africa (IDA & IBRD countries)Middle incomeMoldovaMongoliaMontenegroMoroccoMozambiqueMyanmarNamibiaNepalNetherlandsNew ZealandNicaraguaNigerNigeriaNorth AmericaNorwayOECD membersOmanOther small statesPacific island small statesPakistanPalauPanamaPapua New GuineaParaguayPeruPhilippinesPolandPortugalPost-demographic dividendPre-demographic dividendPuerto RicoQatarRomaniaRussian FederationRwandaSamoaSan MarinoSao Tome and PrincipeSaudi ArabiaSenegalSerbiaSeychellesSierra LeoneSingaporeSlovak RepublicSloveniaSmall statesSomaliaSouth AfricaSouth AsiaSouth Asia (IDA & IBRD)SpainSri LankaSt. Kitts and NevisSt. LuciaSt. Vincent and the GrenadinesSub-Saharan Africa Sub-Saharan Africa (excluding high income)Sub-Saharan Africa (IDA & IBRD countries)SudanSurinameSwazilandSwedenSwitzerlandSyrian Arab RepublicTajikistanTanzaniaThailandTimor-LesteTogoTongaTrinidad and TobagoTunisiaTurkeyTurkmenistanUgandaUkraineUnited Arab EmiratesUnited KingdomUnited StatesUpper middle incomeUruguayUzbekistanVanuatuVenezuela, RBVietnamWest Bank and GazaWorldYemen, Rep.ZambiaZimbabwe Timeline:
This timeline shows a graph from 1972 to 2013 of Guyana. No data until 1971. Number of actual observations by date: 28.
Source name:
World Development Indicators
Source organization:
UNESCO Institute for Statistics
Categories, topics:
Education
Last updated:
apr 23, 2017
Indicators value changes by year
Maximum:
14.153
jan 1, 2008
At the date of observation
Value
Absolute change
Change from previous value
jan 1, 1972
1.602
+1.602
0.0%
jan 1, 1973
1.715
+0.114
7.09%
jan 1, 1974
1.878
+0.163
9.5%
jan 1, 1977
3.6
+1.722
91.7%
jan 1, 1980
3.06
-0.54
-15.01%
jan 1, 1981
2.864
-0.196
-6.39%
jan 1, 1982
2.78
-0.085
-2.95%
jan 1, 1983
3.104
+0.325
11.67%
jan 1, 1984
2.341
-0.763
-24.59%
jan 1, 1985
2.447
+0.106
4.53%
jan 1, 1986
2.701
+0.255
10.41%
jan 1, 1987
2.766
+0.065
2.41%
jan 1, 1989
4.464
+1.698
61.39%
jan 1, 1991
5.789
+1.325
29.67%
jan 1, 1995
9.75
+3.961
68.43%
jan 1, 1996
8.993
-0.758
-7.77%
jan 1, 1997
9.928
+0.936
10.41%
jan 1, 1998
11.589
+1.661
16.73%
jan 1, 2004
7.855
-3.734
-32.22%
jan 1, 2005
11.71
+3.855
49.07%
jan 1, 2006
12.874
+1.165
9.95%
jan 1, 2007
13.687
+0.813
6.31%
jan 1, 2008
14.153
+0.466
3.4%
jan 1, 2009
13.443
-0.709
-5.01%
jan 1, 2010
12.517
-0.926
-6.89%
jan 1, 2011
13.066
+0.549
4.39%
jan 1, 2012
12.848
-0.218
-1.67%
jan 1, 2013
12.481
-0.367
-2.86%
Ranking of countries by current statistics by years


Comments: