29
/
en
AIzaSyAYiBZKx7MnpbEhh9jyipgxe19OcubqV5w
April 1, 2024
56266
Small states
SST
false
2
1
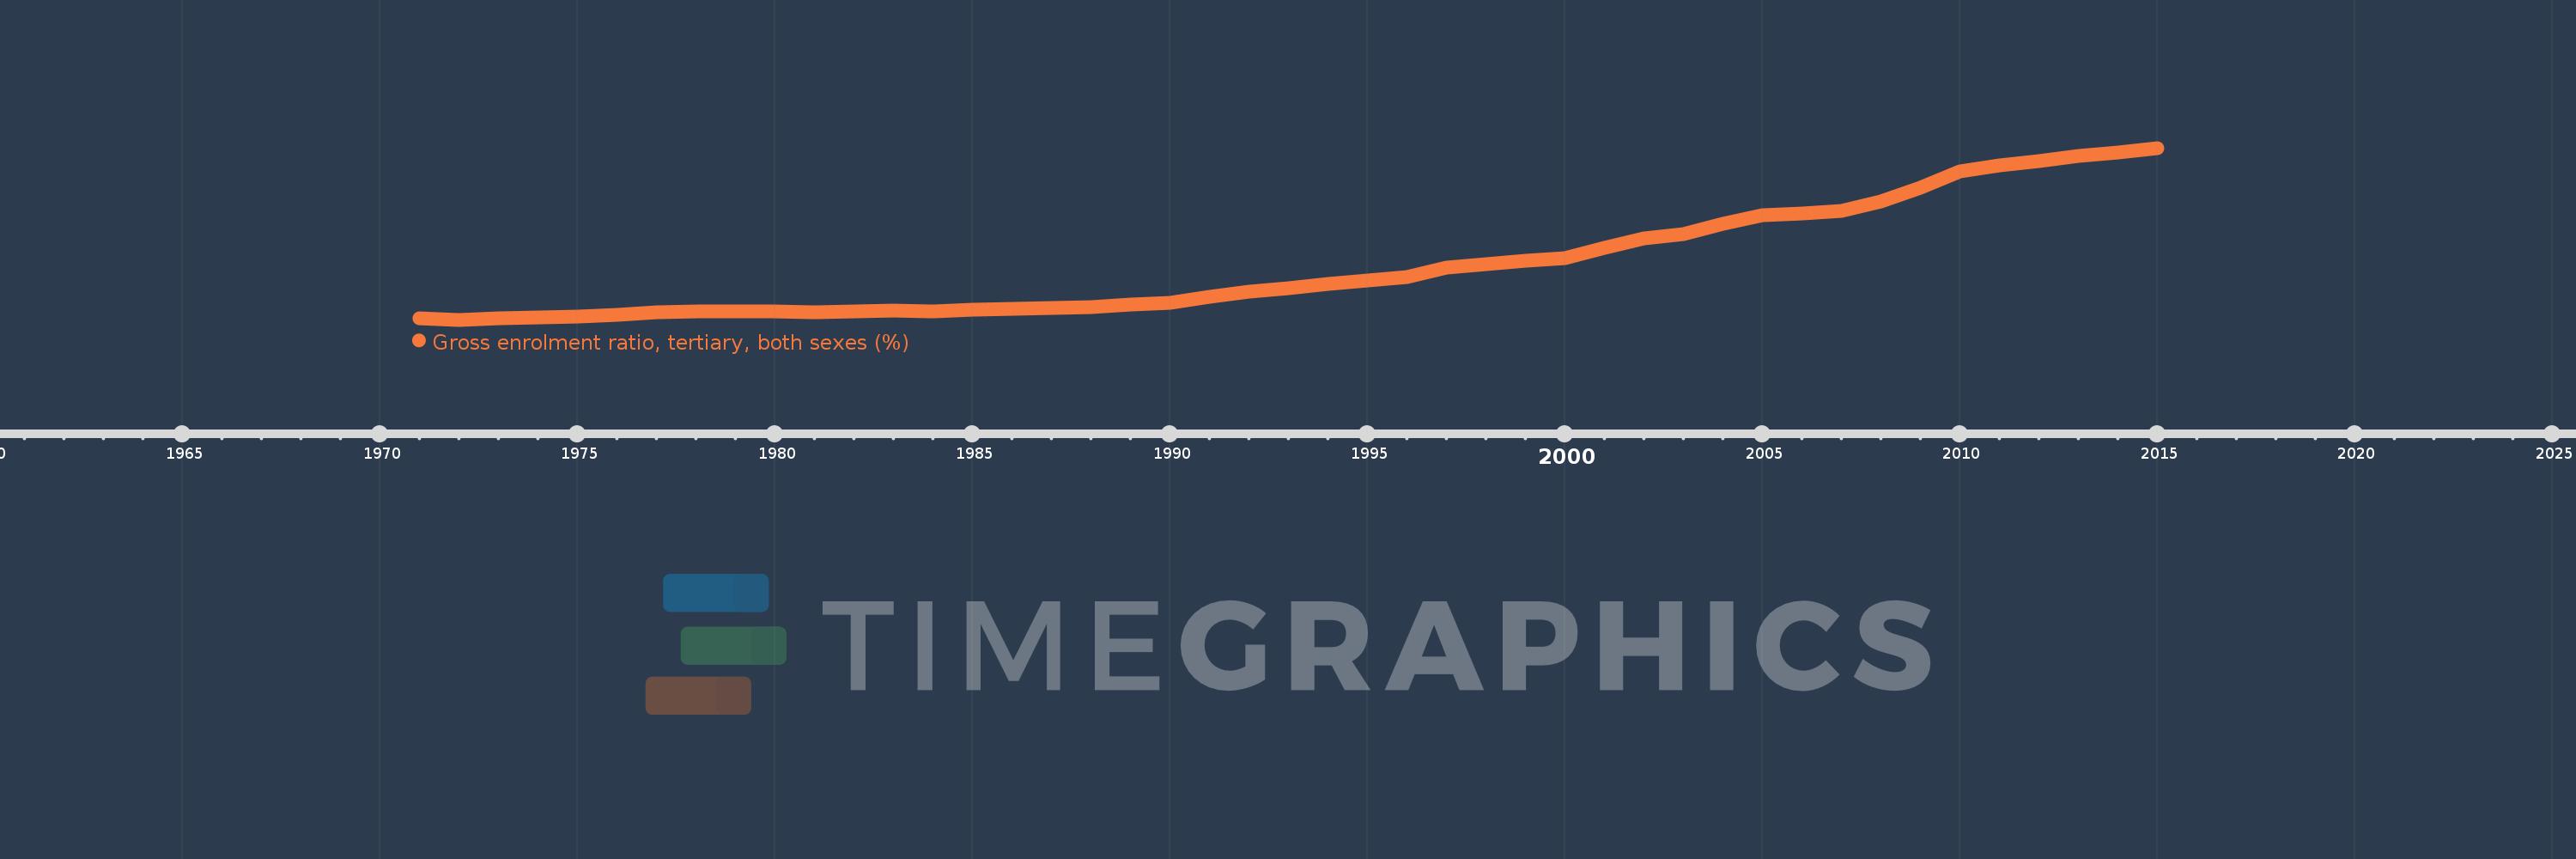
Gross enrolment ratio, tertiary, both sexes (%)
2015,2014,2013,2012,2011,2010,2009,2008,2007,2006,2005,2004,2003,2002,2001,2000,1999,1998,1997,1996,1995,1994,1993,1992,1991,1990,1989,1988,1987,1986,1985,1984,1983,1982,1981,1980,1979,1978,1977,1976,1975,1974,1973,1972,1971
This statistics in other country:
AfghanistanAlbaniaAlgeriaAngolaAntigua and BarbudaArab WorldArgentinaArmeniaArubaAustraliaAustriaAzerbaijanBahamas, TheBahrainBangladeshBarbadosBelarusBelgiumBelizeBeninBermudaBhutanBoliviaBosnia and HerzegovinaBotswanaBrazilBritish Virgin IslandsBrunei DarussalamBulgariaBurkina FasoBurundiCabo VerdeCambodiaCameroonCanadaCaribbean small statesCentral African RepublicCentral Europe and the BalticsChadChileChinaColombiaComorosCongo, Dem. Rep.Congo, Rep.Costa RicaCote d'IvoireCroatiaCubaCuracaoCyprusCzech RepublicDenmarkDjiboutiDominicaDominican RepublicEarly-demographic dividendEast Asia & PacificEast Asia & Pacific (excluding high income)East Asia & Pacific (IDA & IBRD countries)EcuadorEgypt, Arab Rep.El SalvadorEquatorial GuineaEritreaEstoniaEthiopiaEuro areaEurope & Central AsiaEurope & Central Asia (excluding high income)Europe & Central Asia (IDA & IBRD countries)European UnionFijiFinlandFragile and conflict affected situationsFranceGabonGambia, TheGeorgiaGermanyGhanaGreeceGrenadaGuatemalaGuineaGuinea-BissauGuyanaHaitiHeavily indebted poor countries (HIPC)High incomeHondurasHong Kong SAR, ChinaHungaryIBRD onlyIcelandIDA & IBRD totalIDA blendIDA onlyIDA totalIndiaIndonesiaIran, Islamic Rep.IraqIrelandIsraelItalyJamaicaJapanJordanKazakhstanKenyaKorea, Dem. People’s Rep.Korea, Rep.KuwaitKyrgyz RepublicLao PDRLate-demographic dividendLatin America & Caribbean Latin America & Caribbean (excluding high income)Latin America & the Caribbean (IDA & IBRD countries)LatviaLeast developed countries: UN classificationLebanonLesothoLiberiaLibyaLiechtensteinLithuaniaLow & middle incomeLow incomeLower middle incomeLuxembourgMacao SAR, ChinaMacedonia, FYRMadagascarMalawiMalaysiaMaldivesMaliMaltaMarshall IslandsMauritaniaMauritiusMexicoMicronesia, Fed. Sts.Middle East & North AfricaMiddle East & North Africa (excluding high income)Middle East & North Africa (IDA & IBRD countries)Middle incomeMoldovaMongoliaMontenegroMoroccoMozambiqueMyanmarNamibiaNepalNetherlandsNew ZealandNicaraguaNigerNigeriaNorth AmericaNorwayOECD membersOmanOther small statesPacific island small statesPakistanPalauPanamaPapua New GuineaParaguayPeruPhilippinesPolandPortugalPost-demographic dividendPre-demographic dividendPuerto RicoQatarRomaniaRussian FederationRwandaSamoaSan MarinoSao Tome and PrincipeSaudi ArabiaSenegalSerbiaSeychellesSierra LeoneSingaporeSlovak RepublicSloveniaSmall statesSomaliaSouth AfricaSouth AsiaSouth Asia (IDA & IBRD)SpainSri LankaSt. Kitts and NevisSt. LuciaSt. Vincent and the GrenadinesSub-Saharan Africa Sub-Saharan Africa (excluding high income)Sub-Saharan Africa (IDA & IBRD countries)SudanSurinameSwazilandSwedenSwitzerlandSyrian Arab RepublicTajikistanTanzaniaThailandTimor-LesteTogoTongaTrinidad and TobagoTunisiaTurkeyTurkmenistanUgandaUkraineUnited Arab EmiratesUnited KingdomUnited StatesUpper middle incomeUruguayUzbekistanVanuatuVenezuela, RBVietnamWest Bank and GazaWorldYemen, Rep.ZambiaZimbabwe Timeline:
This timeline shows a graph from 1971 to 2015 of Small states. No data until 1970. Number of actual observations by date: 45.
Source name:
World Development Indicators
Source organization:
UNESCO Institute for Statistics
Categories, topics:
Education
Last updated:
apr 23, 2017
Indicators value changes by year
Maximum:
18.544
jan 1, 2015
At the date of observation
Value
Absolute change
Change from previous value
jan 1, 1971
4.835
+4.835
0.0%
jan 1, 1972
4.75
-0.085
-1.75%
jan 1, 1973
4.855
+0.104
2.2%
jan 1, 1974
4.919
+0.064
1.33%
jan 1, 1975
4.977
+0.058
1.17%
jan 1, 1976
5.128
+0.152
3.04%
jan 1, 1977
5.34
+0.212
4.13%
jan 1, 1978
5.452
+0.112
2.1%
jan 1, 1979
5.41
-0.042
-0.77%
jan 1, 1980
5.408
-0.002
-0.04%
jan 1, 1981
5.355
-0.053
-0.99%
jan 1, 1982
5.422
+0.067
1.25%
jan 1, 1983
5.504
+0.082
1.51%
jan 1, 1984
5.443
-0.061
-1.11%
jan 1, 1985
5.532
+0.09
1.65%
jan 1, 1986
5.637
+0.105
1.9%
jan 1, 1987
5.7
+0.063
1.12%
jan 1, 1988
5.759
+0.058
1.03%
jan 1, 1989
5.949
+0.19
3.3%
jan 1, 1990
6.142
+0.193
3.25%
jan 1, 1991
6.595
+0.453
7.38%
jan 1, 1992
6.984
+0.389
5.9%
jan 1, 1993
7.264
+0.28
4.01%
jan 1, 1994
7.62
+0.356
4.9%
jan 1, 1995
7.933
+0.313
4.11%
jan 1, 1996
8.169
+0.236
2.97%
jan 1, 1997
8.959
+0.789
9.66%
jan 1, 1998
9.181
+0.223
2.48%
jan 1, 1999
9.473
+0.292
3.18%
jan 1, 2000
9.679
+0.206
2.17%
jan 1, 2001
10.501
+0.822
8.5%
jan 1, 2002
11.283
+0.782
7.44%
jan 1, 2003
11.632
+0.349
3.09%
jan 1, 2004
12.468
+0.837
7.19%
jan 1, 2005
13.145
+0.677
5.43%
jan 1, 2006
13.285
+0.14
1.06%
jan 1, 2007
13.499
+0.214
1.61%
jan 1, 2008
14.227
+0.728
5.39%
jan 1, 2009
15.379
+1.152
8.1%
jan 1, 2010
16.672
+1.293
8.41%
jan 1, 2011
17.126
+0.454
2.72%
jan 1, 2012
17.496
+0.37
2.16%
jan 1, 2013
17.929
+0.433
2.48%
jan 1, 2014
18.203
+0.274
1.53%
jan 1, 2015
18.544
+0.341
1.87%
Ranking of countries by current statistics by years


Comments: