29
/
en
AIzaSyAYiBZKx7MnpbEhh9jyipgxe19OcubqV5w
April 1, 2024
116945
Cyprus
CYP
true
2
1
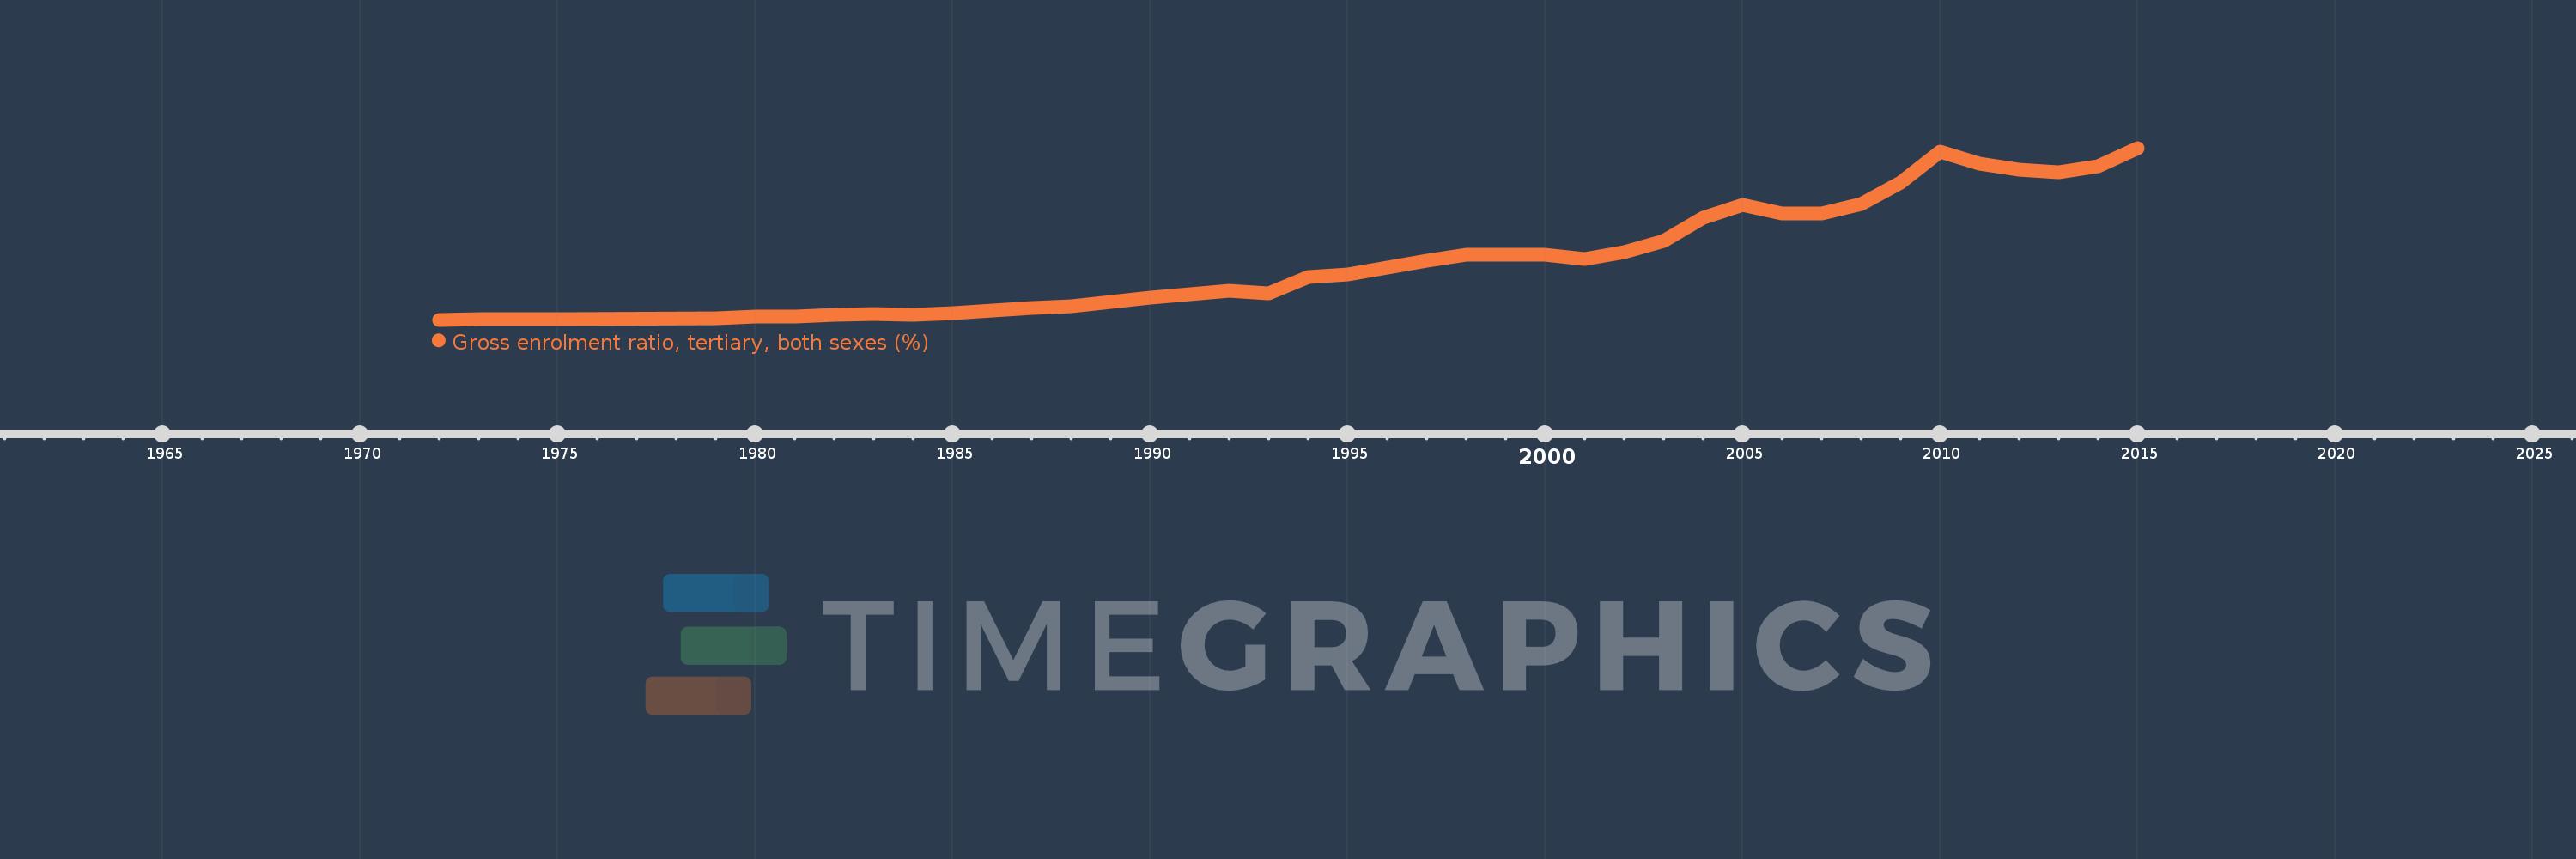
Gross enrolment ratio, tertiary, both sexes (%)
2015,2014,2013,2012,2011,2010,2009,2008,2007,2006,2005,2004,2003,2002,2001,2000,1998,1997,1996,1995,1994,1993,1992,1991,1990,1989,1988,1987,1986,1985,1984,1983,1982,1981,1980,1979,1975,1974,1973,1972
This statistics in other country:
AfghanistanAlbaniaAlgeriaAngolaAntigua and BarbudaArab WorldArgentinaArmeniaArubaAustraliaAustriaAzerbaijanBahamas, TheBahrainBangladeshBarbadosBelarusBelgiumBelizeBeninBermudaBhutanBoliviaBosnia and HerzegovinaBotswanaBrazilBritish Virgin IslandsBrunei DarussalamBulgariaBurkina FasoBurundiCabo VerdeCambodiaCameroonCanadaCaribbean small statesCentral African RepublicCentral Europe and the BalticsChadChileChinaColombiaComorosCongo, Dem. Rep.Congo, Rep.Costa RicaCote d'IvoireCroatiaCubaCuracaoCyprusCzech RepublicDenmarkDjiboutiDominicaDominican RepublicEarly-demographic dividendEast Asia & PacificEast Asia & Pacific (excluding high income)East Asia & Pacific (IDA & IBRD countries)EcuadorEgypt, Arab Rep.El SalvadorEquatorial GuineaEritreaEstoniaEthiopiaEuro areaEurope & Central AsiaEurope & Central Asia (excluding high income)Europe & Central Asia (IDA & IBRD countries)European UnionFijiFinlandFragile and conflict affected situationsFranceGabonGambia, TheGeorgiaGermanyGhanaGreeceGrenadaGuatemalaGuineaGuinea-BissauGuyanaHaitiHeavily indebted poor countries (HIPC)High incomeHondurasHong Kong SAR, ChinaHungaryIBRD onlyIcelandIDA & IBRD totalIDA blendIDA onlyIDA totalIndiaIndonesiaIran, Islamic Rep.IraqIrelandIsraelItalyJamaicaJapanJordanKazakhstanKenyaKorea, Dem. People’s Rep.Korea, Rep.KuwaitKyrgyz RepublicLao PDRLate-demographic dividendLatin America & Caribbean Latin America & Caribbean (excluding high income)Latin America & the Caribbean (IDA & IBRD countries)LatviaLeast developed countries: UN classificationLebanonLesothoLiberiaLibyaLiechtensteinLithuaniaLow & middle incomeLow incomeLower middle incomeLuxembourgMacao SAR, ChinaMacedonia, FYRMadagascarMalawiMalaysiaMaldivesMaliMaltaMarshall IslandsMauritaniaMauritiusMexicoMicronesia, Fed. Sts.Middle East & North AfricaMiddle East & North Africa (excluding high income)Middle East & North Africa (IDA & IBRD countries)Middle incomeMoldovaMongoliaMontenegroMoroccoMozambiqueMyanmarNamibiaNepalNetherlandsNew ZealandNicaraguaNigerNigeriaNorth AmericaNorwayOECD membersOmanOther small statesPacific island small statesPakistanPalauPanamaPapua New GuineaParaguayPeruPhilippinesPolandPortugalPost-demographic dividendPre-demographic dividendPuerto RicoQatarRomaniaRussian FederationRwandaSamoaSan MarinoSao Tome and PrincipeSaudi ArabiaSenegalSerbiaSeychellesSierra LeoneSingaporeSlovak RepublicSloveniaSmall statesSomaliaSouth AfricaSouth AsiaSouth Asia (IDA & IBRD)SpainSri LankaSt. Kitts and NevisSt. LuciaSt. Vincent and the GrenadinesSub-Saharan Africa Sub-Saharan Africa (excluding high income)Sub-Saharan Africa (IDA & IBRD countries)SudanSurinameSwazilandSwedenSwitzerlandSyrian Arab RepublicTajikistanTanzaniaThailandTimor-LesteTogoTongaTrinidad and TobagoTunisiaTurkeyTurkmenistanUgandaUkraineUnited Arab EmiratesUnited KingdomUnited StatesUpper middle incomeUruguayUzbekistanVanuatuVenezuela, RBVietnamWest Bank and GazaWorldYemen, Rep.ZambiaZimbabwe Timeline:
This timeline shows a graph from 1972 to 2015 of Cyprus. No data until 1971. Number of actual observations by date: 40.
Source name:
World Development Indicators
Source organization:
UNESCO Institute for Statistics
Categories, topics:
Education
Last updated:
apr 23, 2017
Indicators value changes by year
Maximum:
53.104
jan 1, 2015
At the date of observation
Value
Absolute change
Change from previous value
jan 1, 1972
1.301
+1.301
0.0%
jan 1, 1973
1.46
+0.16
12.28%
jan 1, 1974
1.599
+0.139
9.5%
jan 1, 1975
1.425
-0.174
-10.9%
jan 1, 1979
1.713
+0.288
20.2%
jan 1, 1980
2.196
+0.484
28.25%
jan 1, 1981
2.246
+0.05
2.26%
jan 1, 1982
2.868
+0.622
27.7%
jan 1, 1983
3.029
+0.161
5.6%
jan 1, 1984
2.801
-0.228
-7.53%
jan 1, 1985
3.405
+0.604
21.58%
jan 1, 1986
3.964
+0.559
16.41%
jan 1, 1987
4.835
+0.871
21.96%
jan 1, 1988
5.429
+0.595
12.3%
jan 1, 1989
6.755
+1.326
24.42%
jan 1, 1990
7.934
+1.179
17.46%
jan 1, 1991
9.027
+1.093
13.77%
jan 1, 1992
10.125
+1.097
12.16%
jan 1, 1993
9.247
-0.878
-8.67%
jan 1, 1994
14.073
+4.826
52.19%
jan 1, 1995
15.028
+0.956
6.79%
jan 1, 1996
17.017
+1.988
13.23%
jan 1, 1997
19.18
+2.163
12.71%
jan 1, 1998
20.935
+1.756
9.15%
jan 1, 2000
21.032
+0.097
0.46%
jan 1, 2001
19.562
-1.47
-6.99%
jan 1, 2002
21.613
+2.05
10.48%
jan 1, 2003
25.102
+3.49
16.15%
jan 1, 2004
31.964
+6.861
27.33%
jan 1, 2005
35.864
+3.9
12.2%
jan 1, 2006
33.221
-2.643
-7.37%
jan 1, 2007
33.42
+0.199
0.6%
jan 1, 2008
36.174
+2.754
8.24%
jan 1, 2009
42.618
+6.444
17.81%
jan 1, 2010
52.004
+9.386
22.02%
jan 1, 2011
48.312
-3.692
-7.1%
jan 1, 2012
46.54
-1.772
-3.67%
jan 1, 2013
45.864
-0.676
-1.45%
jan 1, 2014
47.525
+1.662
3.62%
jan 1, 2015
53.104
+5.579
11.74%
Ranking of countries by current statistics by years


Comments: