29
/
en
AIzaSyAYiBZKx7MnpbEhh9jyipgxe19OcubqV5w
April 1, 2024
39952
IDA total
IDA
false
2
1
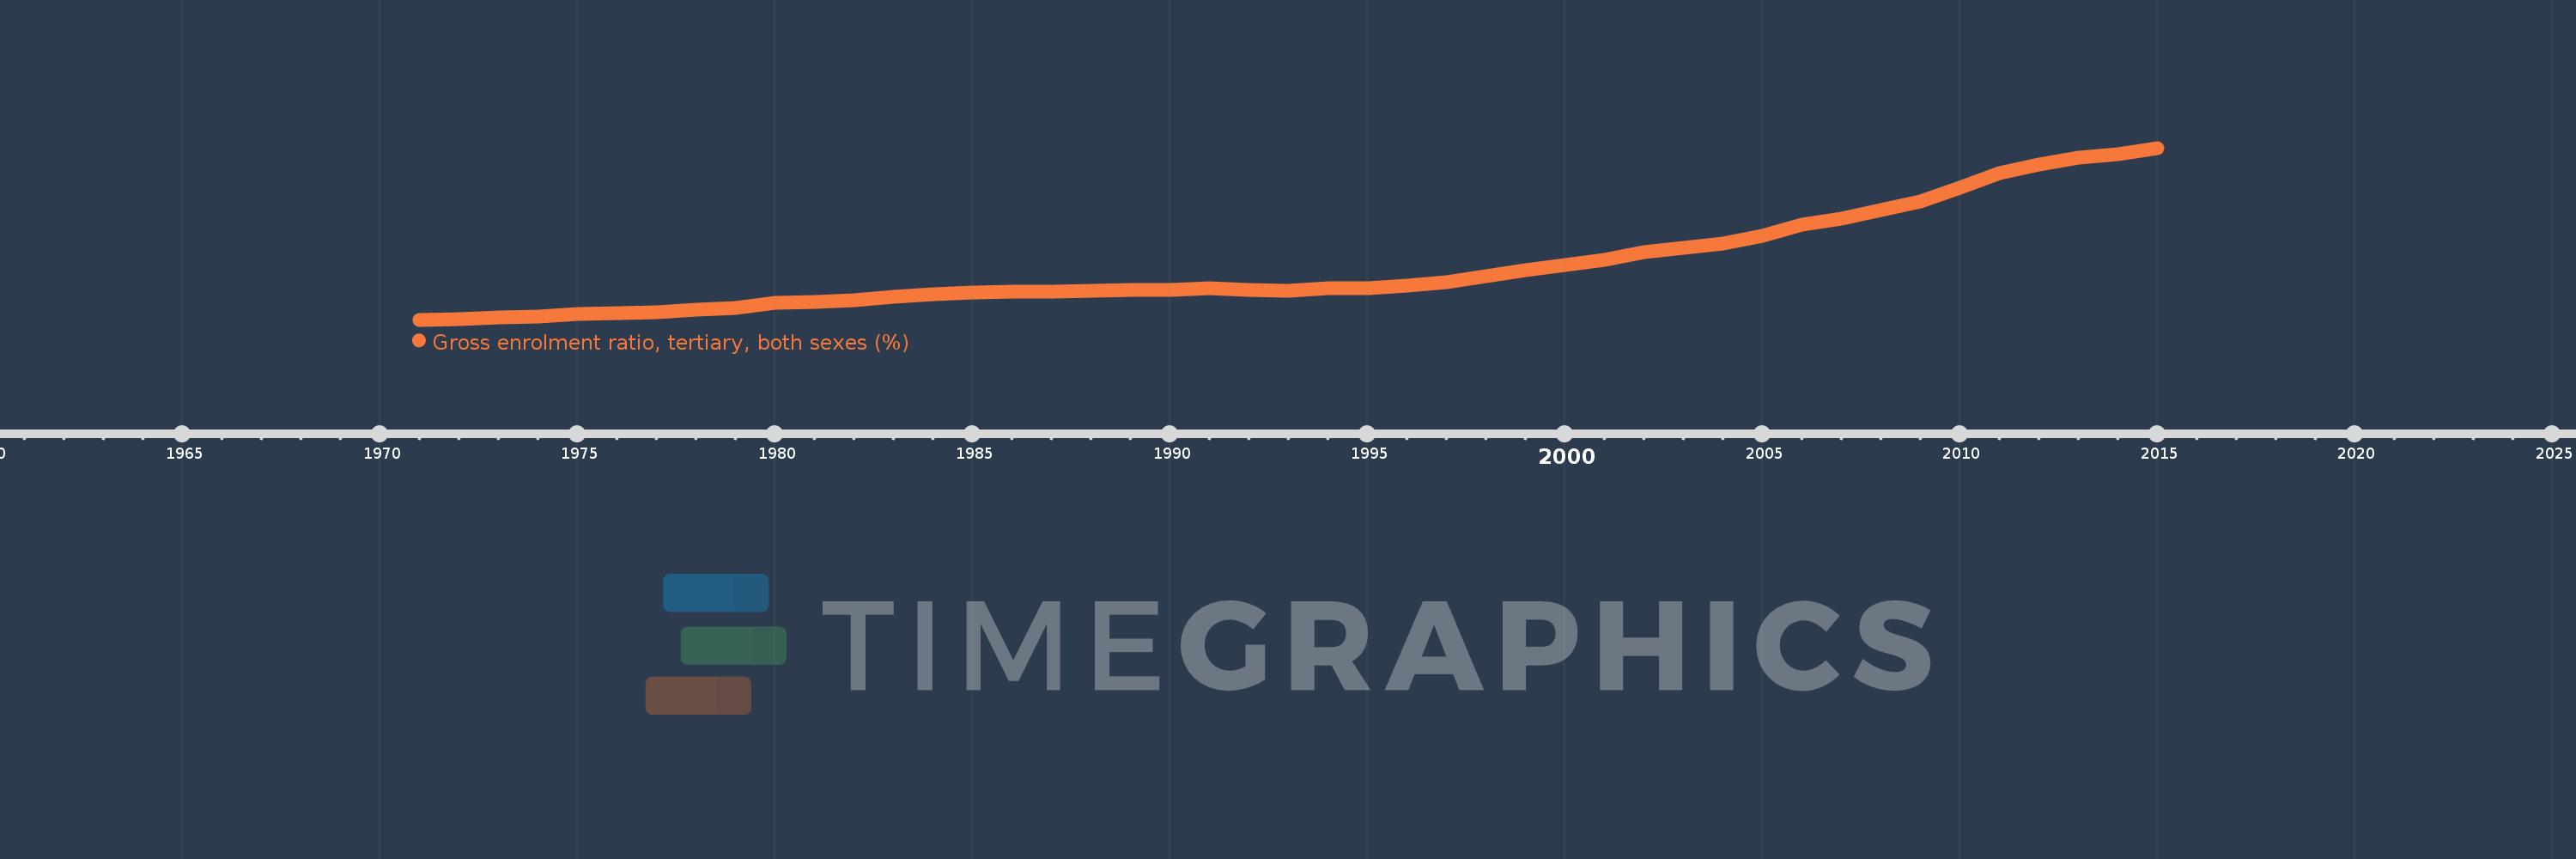
Gross enrolment ratio, tertiary, both sexes (%)
2015,2014,2013,2012,2011,2010,2009,2008,2007,2006,2005,2004,2003,2002,2001,2000,1999,1998,1997,1996,1995,1994,1993,1992,1991,1990,1989,1988,1987,1986,1985,1984,1983,1982,1981,1980,1979,1978,1977,1976,1975,1974,1973,1972,1971
This statistics in other country:
AfghanistanAlbaniaAlgeriaAngolaAntigua and BarbudaArab WorldArgentinaArmeniaArubaAustraliaAustriaAzerbaijanBahamas, TheBahrainBangladeshBarbadosBelarusBelgiumBelizeBeninBermudaBhutanBoliviaBosnia and HerzegovinaBotswanaBrazilBritish Virgin IslandsBrunei DarussalamBulgariaBurkina FasoBurundiCabo VerdeCambodiaCameroonCanadaCaribbean small statesCentral African RepublicCentral Europe and the BalticsChadChileChinaColombiaComorosCongo, Dem. Rep.Congo, Rep.Costa RicaCote d'IvoireCroatiaCubaCuracaoCyprusCzech RepublicDenmarkDjiboutiDominicaDominican RepublicEarly-demographic dividendEast Asia & PacificEast Asia & Pacific (excluding high income)East Asia & Pacific (IDA & IBRD countries)EcuadorEgypt, Arab Rep.El SalvadorEquatorial GuineaEritreaEstoniaEthiopiaEuro areaEurope & Central AsiaEurope & Central Asia (excluding high income)Europe & Central Asia (IDA & IBRD countries)European UnionFijiFinlandFragile and conflict affected situationsFranceGabonGambia, TheGeorgiaGermanyGhanaGreeceGrenadaGuatemalaGuineaGuinea-BissauGuyanaHaitiHeavily indebted poor countries (HIPC)High incomeHondurasHong Kong SAR, ChinaHungaryIBRD onlyIcelandIDA & IBRD totalIDA blendIDA onlyIDA totalIndiaIndonesiaIran, Islamic Rep.IraqIrelandIsraelItalyJamaicaJapanJordanKazakhstanKenyaKorea, Dem. People’s Rep.Korea, Rep.KuwaitKyrgyz RepublicLao PDRLate-demographic dividendLatin America & Caribbean Latin America & Caribbean (excluding high income)Latin America & the Caribbean (IDA & IBRD countries)LatviaLeast developed countries: UN classificationLebanonLesothoLiberiaLibyaLiechtensteinLithuaniaLow & middle incomeLow incomeLower middle incomeLuxembourgMacao SAR, ChinaMacedonia, FYRMadagascarMalawiMalaysiaMaldivesMaliMaltaMarshall IslandsMauritaniaMauritiusMexicoMicronesia, Fed. Sts.Middle East & North AfricaMiddle East & North Africa (excluding high income)Middle East & North Africa (IDA & IBRD countries)Middle incomeMoldovaMongoliaMontenegroMoroccoMozambiqueMyanmarNamibiaNepalNetherlandsNew ZealandNicaraguaNigerNigeriaNorth AmericaNorwayOECD membersOmanOther small statesPacific island small statesPakistanPalauPanamaPapua New GuineaParaguayPeruPhilippinesPolandPortugalPost-demographic dividendPre-demographic dividendPuerto RicoQatarRomaniaRussian FederationRwandaSamoaSan MarinoSao Tome and PrincipeSaudi ArabiaSenegalSerbiaSeychellesSierra LeoneSingaporeSlovak RepublicSloveniaSmall statesSomaliaSouth AfricaSouth AsiaSouth Asia (IDA & IBRD)SpainSri LankaSt. Kitts and NevisSt. LuciaSt. Vincent and the GrenadinesSub-Saharan Africa Sub-Saharan Africa (excluding high income)Sub-Saharan Africa (IDA & IBRD countries)SudanSurinameSwazilandSwedenSwitzerlandSyrian Arab RepublicTajikistanTanzaniaThailandTimor-LesteTogoTongaTrinidad and TobagoTunisiaTurkeyTurkmenistanUgandaUkraineUnited Arab EmiratesUnited KingdomUnited StatesUpper middle incomeUruguayUzbekistanVanuatuVenezuela, RBVietnamWest Bank and GazaWorldYemen, Rep.ZambiaZimbabwe Timeline:
This timeline shows a graph from 1971 to 2015 of IDA total. No data until 1970. Number of actual observations by date: 45.
Source name:
World Development Indicators
Source organization:
UNESCO Institute for Statistics
Categories, topics:
Education
Last updated:
apr 23, 2017
Indicators value changes by year
Maximum:
11.345
jan 1, 2015
At the date of observation
Value
Absolute change
Change from previous value
jan 1, 1971
2.233
+2.233
0.0%
jan 1, 1972
2.281
+0.048
2.17%
jan 1, 1973
2.339
+0.058
2.55%
jan 1, 1974
2.411
+0.072
3.08%
jan 1, 1975
2.559
+0.148
6.13%
jan 1, 1976
2.584
+0.025
0.98%
jan 1, 1977
2.618
+0.034
1.32%
jan 1, 1978
2.77
+0.152
5.82%
jan 1, 1979
2.857
+0.087
3.12%
jan 1, 1980
3.127
+0.27
9.46%
jan 1, 1981
3.194
+0.067
2.13%
jan 1, 1982
3.268
+0.074
2.31%
jan 1, 1983
3.435
+0.168
5.13%
jan 1, 1984
3.573
+0.138
4.01%
jan 1, 1985
3.659
+0.086
2.4%
jan 1, 1986
3.704
+0.045
1.23%
jan 1, 1987
3.731
+0.027
0.72%
jan 1, 1988
3.77
+0.039
1.05%
jan 1, 1989
3.796
+0.026
0.7%
jan 1, 1990
3.835
+0.038
1.0%
jan 1, 1991
3.912
+0.077
2.02%
jan 1, 1992
3.833
-0.079
-2.02%
jan 1, 1993
3.768
-0.065
-1.7%
jan 1, 1994
3.886
+0.118
3.12%
jan 1, 1995
3.927
+0.041
1.05%
jan 1, 1996
4.026
+0.099
2.53%
jan 1, 1997
4.214
+0.188
4.68%
jan 1, 1998
4.534
+0.32
7.59%
jan 1, 1999
4.88
+0.346
7.63%
jan 1, 2000
5.151
+0.271
5.55%
jan 1, 2001
5.391
+0.24
4.65%
jan 1, 2002
5.828
+0.437
8.11%
jan 1, 2003
6.054
+0.226
3.88%
jan 1, 2004
6.278
+0.224
3.7%
jan 1, 2005
6.664
+0.387
6.16%
jan 1, 2006
7.255
+0.59
8.86%
jan 1, 2007
7.604
+0.349
4.81%
jan 1, 2008
8.06
+0.456
6.0%
jan 1, 2009
8.5
+0.44
5.46%
jan 1, 2010
9.253
+0.754
8.87%
jan 1, 2011
10.002
+0.749
8.09%
jan 1, 2012
10.481
+0.479
4.78%
jan 1, 2013
10.824
+0.343
3.28%
jan 1, 2014
11.019
+0.195
1.8%
jan 1, 2015
11.345
+0.326
2.96%
Ranking of countries by current statistics by years


Comments: