29
/
en
AIzaSyAYiBZKx7MnpbEhh9jyipgxe19OcubqV5w
April 1, 2024
201629
Morocco
MAR
true
2
1
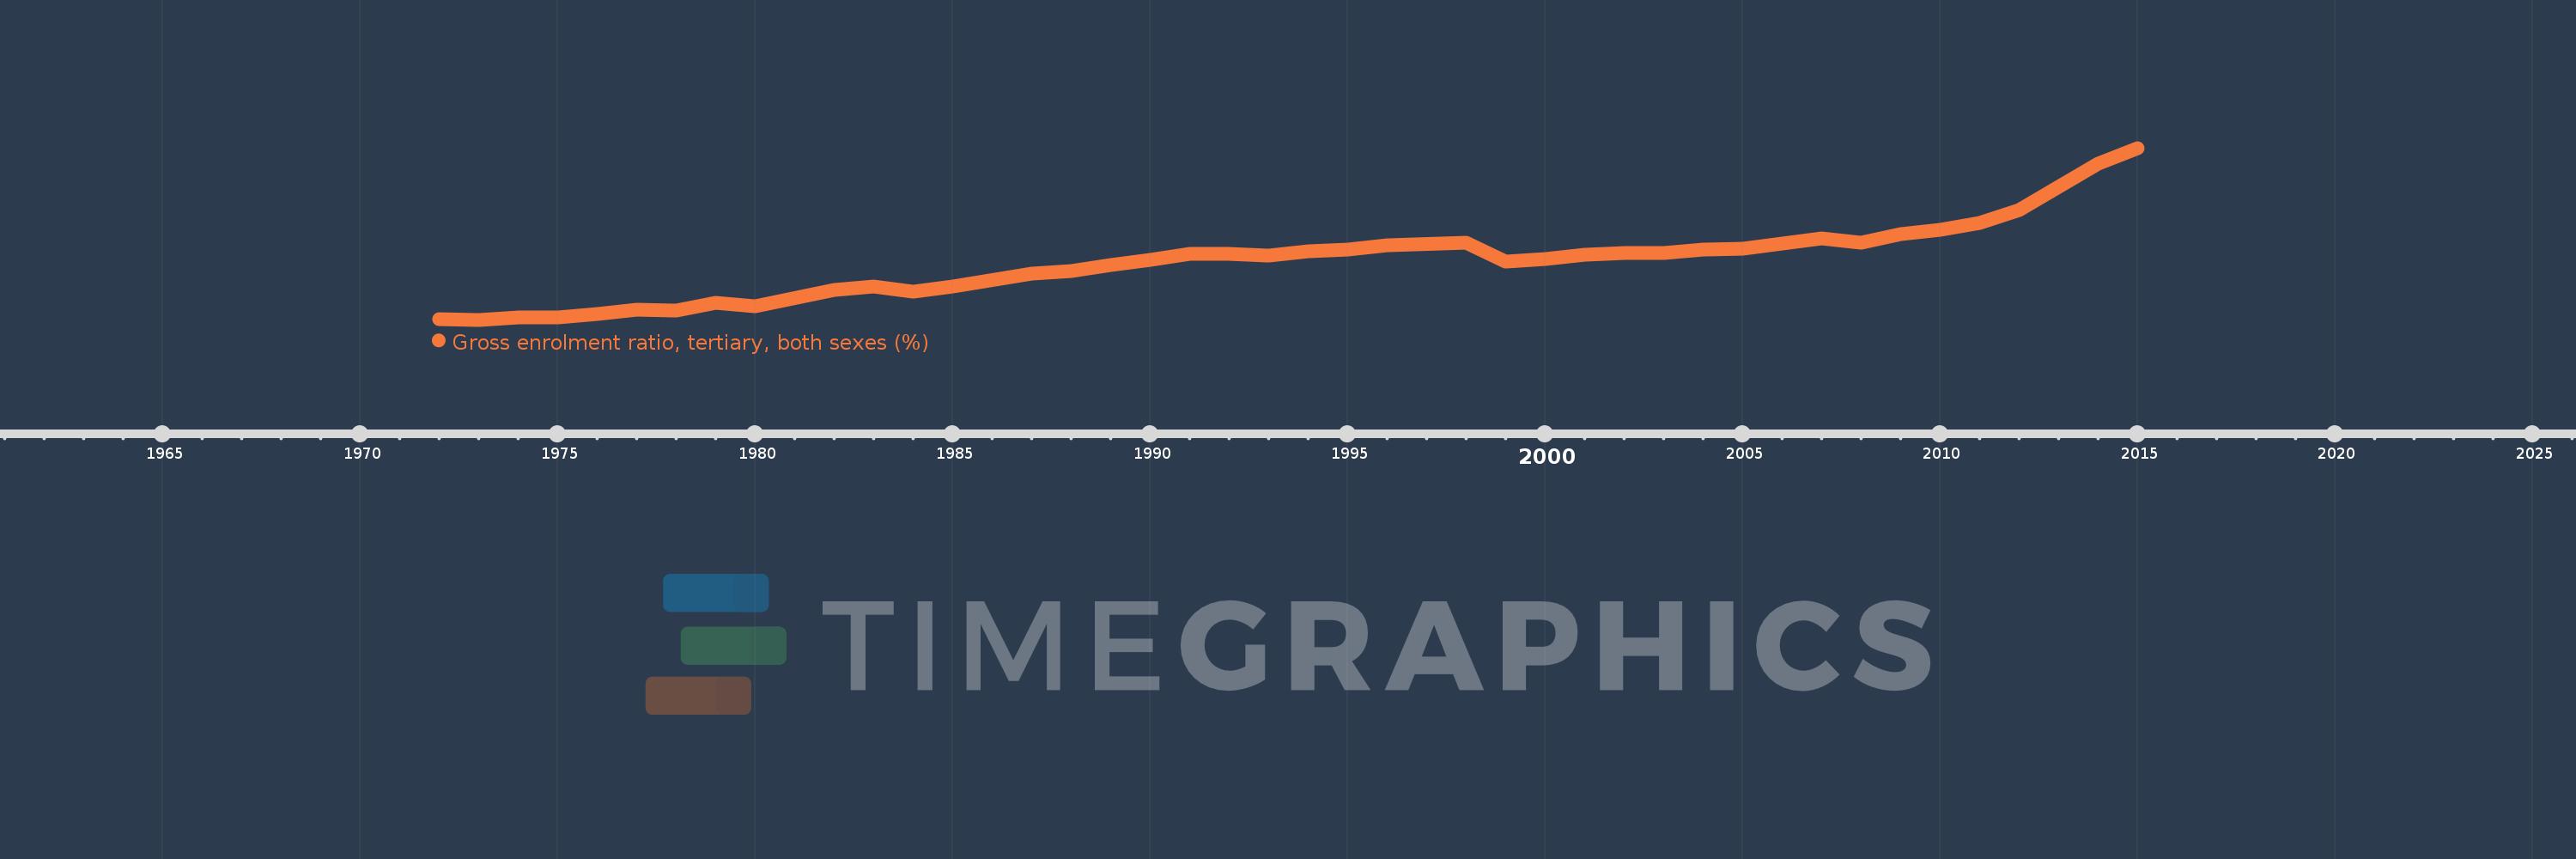
Gross enrolment ratio, tertiary, both sexes (%)
2015,2014,2013,2012,2011,2010,2009,2008,2007,2006,2005,2004,2003,2002,2001,2000,1999,1998,1996,1995,1994,1993,1992,1991,1990,1989,1988,1987,1985,1984,1983,1982,1980,1979,1978,1977,1976,1975,1974,1973,1972
This statistics in other country:
AfghanistanAlbaniaAlgeriaAngolaAntigua and BarbudaArab WorldArgentinaArmeniaArubaAustraliaAustriaAzerbaijanBahamas, TheBahrainBangladeshBarbadosBelarusBelgiumBelizeBeninBermudaBhutanBoliviaBosnia and HerzegovinaBotswanaBrazilBritish Virgin IslandsBrunei DarussalamBulgariaBurkina FasoBurundiCabo VerdeCambodiaCameroonCanadaCaribbean small statesCentral African RepublicCentral Europe and the BalticsChadChileChinaColombiaComorosCongo, Dem. Rep.Congo, Rep.Costa RicaCote d'IvoireCroatiaCubaCuracaoCyprusCzech RepublicDenmarkDjiboutiDominicaDominican RepublicEarly-demographic dividendEast Asia & PacificEast Asia & Pacific (excluding high income)East Asia & Pacific (IDA & IBRD countries)EcuadorEgypt, Arab Rep.El SalvadorEquatorial GuineaEritreaEstoniaEthiopiaEuro areaEurope & Central AsiaEurope & Central Asia (excluding high income)Europe & Central Asia (IDA & IBRD countries)European UnionFijiFinlandFragile and conflict affected situationsFranceGabonGambia, TheGeorgiaGermanyGhanaGreeceGrenadaGuatemalaGuineaGuinea-BissauGuyanaHaitiHeavily indebted poor countries (HIPC)High incomeHondurasHong Kong SAR, ChinaHungaryIBRD onlyIcelandIDA & IBRD totalIDA blendIDA onlyIDA totalIndiaIndonesiaIran, Islamic Rep.IraqIrelandIsraelItalyJamaicaJapanJordanKazakhstanKenyaKorea, Dem. People’s Rep.Korea, Rep.KuwaitKyrgyz RepublicLao PDRLate-demographic dividendLatin America & Caribbean Latin America & Caribbean (excluding high income)Latin America & the Caribbean (IDA & IBRD countries)LatviaLeast developed countries: UN classificationLebanonLesothoLiberiaLibyaLiechtensteinLithuaniaLow & middle incomeLow incomeLower middle incomeLuxembourgMacao SAR, ChinaMacedonia, FYRMadagascarMalawiMalaysiaMaldivesMaliMaltaMarshall IslandsMauritaniaMauritiusMexicoMicronesia, Fed. Sts.Middle East & North AfricaMiddle East & North Africa (excluding high income)Middle East & North Africa (IDA & IBRD countries)Middle incomeMoldovaMongoliaMontenegroMoroccoMozambiqueMyanmarNamibiaNepalNetherlandsNew ZealandNicaraguaNigerNigeriaNorth AmericaNorwayOECD membersOmanOther small statesPacific island small statesPakistanPalauPanamaPapua New GuineaParaguayPeruPhilippinesPolandPortugalPost-demographic dividendPre-demographic dividendPuerto RicoQatarRomaniaRussian FederationRwandaSamoaSan MarinoSao Tome and PrincipeSaudi ArabiaSenegalSerbiaSeychellesSierra LeoneSingaporeSlovak RepublicSloveniaSmall statesSomaliaSouth AfricaSouth AsiaSouth Asia (IDA & IBRD)SpainSri LankaSt. Kitts and NevisSt. LuciaSt. Vincent and the GrenadinesSub-Saharan Africa Sub-Saharan Africa (excluding high income)Sub-Saharan Africa (IDA & IBRD countries)SudanSurinameSwazilandSwedenSwitzerlandSyrian Arab RepublicTajikistanTanzaniaThailandTimor-LesteTogoTongaTrinidad and TobagoTunisiaTurkeyTurkmenistanUgandaUkraineUnited Arab EmiratesUnited KingdomUnited StatesUpper middle incomeUruguayUzbekistanVanuatuVenezuela, RBVietnamWest Bank and GazaWorldYemen, Rep.ZambiaZimbabwe Timeline:
This timeline shows a graph from 1972 to 2015 of Morocco. No data until 1971. Number of actual observations by date: 41.
Source name:
World Development Indicators
Source organization:
UNESCO Institute for Statistics
Categories, topics:
Education
Last updated:
apr 23, 2017
Indicators value changes by year
Maximum:
24.572
jan 1, 2015
At the date of observation
Value
Absolute change
Change from previous value
jan 1, 1972
1.472
+1.472
0.0%
jan 1, 1973
1.422
-0.051
-3.45%
jan 1, 1974
1.708
+0.286
20.12%
jan 1, 1975
1.79
+0.083
4.85%
jan 1, 1976
2.229
+0.438
24.48%
jan 1, 1977
2.783
+0.554
24.87%
jan 1, 1978
2.615
-0.168
-6.02%
jan 1, 1979
3.722
+1.107
42.33%
jan 1, 1980
3.289
-0.434
-11.65%
jan 1, 1982
5.482
+2.193
66.69%
jan 1, 1983
5.909
+0.427
7.79%
jan 1, 1984
5.176
-0.733
-12.41%
jan 1, 1985
5.863
+0.687
13.28%
jan 1, 1987
7.642
+1.779
30.33%
jan 1, 1988
8.034
+0.392
5.13%
jan 1, 1989
8.786
+0.753
9.37%
jan 1, 1990
9.457
+0.671
7.63%
jan 1, 1991
10.26
+0.803
8.49%
jan 1, 1992
10.25
-0.01
-0.1%
jan 1, 1993
10.102
-0.147
-1.44%
jan 1, 1994
10.622
+0.52
5.15%
jan 1, 1995
10.901
+0.279
2.62%
jan 1, 1996
11.5
+0.599
5.49%
jan 1, 1998
11.807
+0.307
2.67%
jan 1, 1999
9.215
-2.592
-21.96%
jan 1, 2000
9.621
+0.406
4.41%
jan 1, 2001
10.164
+0.543
5.65%
jan 1, 2002
10.415
+0.251
2.47%
jan 1, 2003
10.449
+0.033
0.32%
jan 1, 2004
10.85
+0.402
3.84%
jan 1, 2005
11.01
+0.16
1.47%
jan 1, 2006
11.724
+0.714
6.48%
jan 1, 2007
12.334
+0.61
5.2%
jan 1, 2008
11.859
-0.474
-3.85%
jan 1, 2009
13.005
+1.146
9.66%
jan 1, 2010
13.531
+0.526
4.04%
jan 1, 2011
14.414
+0.883
6.53%
jan 1, 2012
16.208
+1.794
12.45%
jan 1, 2013
19.288
+3.08
19.0%
jan 1, 2014
22.467
+3.179
16.48%
jan 1, 2015
24.572
+2.105
9.37%
Ranking of countries by current statistics by years


Comments: