29
/
en
AIzaSyAYiBZKx7MnpbEhh9jyipgxe19OcubqV5w
April 1, 2024
109728
Congo, Dem. Rep.
COD
true
2
1
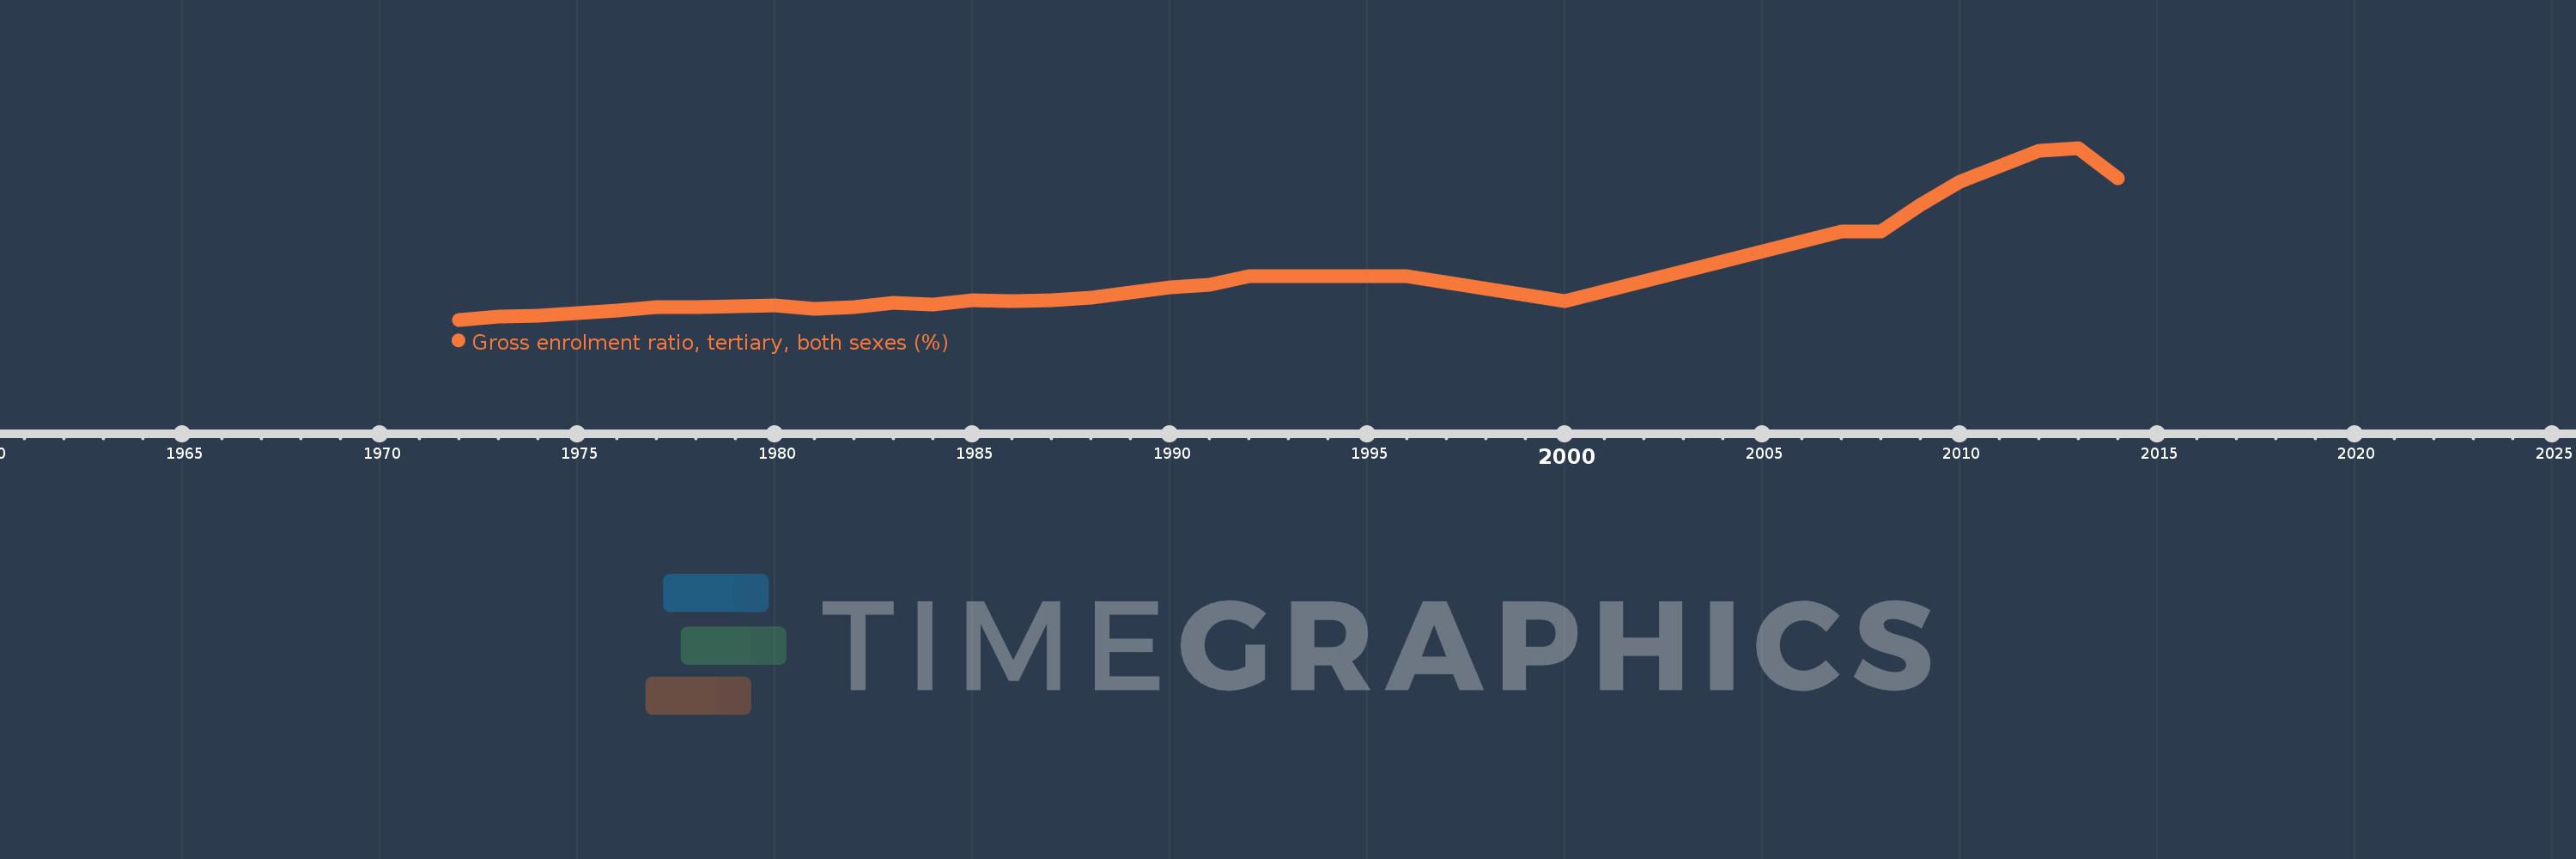
Gross enrolment ratio, tertiary, both sexes (%)
2014,2013,2012,2010,2009,2008,2007,2000,1996,1992,1991,1990,1989,1988,1987,1986,1985,1984,1983,1982,1981,1980,1979,1978,1977,1976,1975,1974,1973,1972
This statistics in other country:
AfghanistanAlbaniaAlgeriaAngolaAntigua and BarbudaArab WorldArgentinaArmeniaArubaAustraliaAustriaAzerbaijanBahamas, TheBahrainBangladeshBarbadosBelarusBelgiumBelizeBeninBermudaBhutanBoliviaBosnia and HerzegovinaBotswanaBrazilBritish Virgin IslandsBrunei DarussalamBulgariaBurkina FasoBurundiCabo VerdeCambodiaCameroonCanadaCaribbean small statesCentral African RepublicCentral Europe and the BalticsChadChileChinaColombiaComorosCongo, Dem. Rep.Congo, Rep.Costa RicaCote d'IvoireCroatiaCubaCuracaoCyprusCzech RepublicDenmarkDjiboutiDominicaDominican RepublicEarly-demographic dividendEast Asia & PacificEast Asia & Pacific (excluding high income)East Asia & Pacific (IDA & IBRD countries)EcuadorEgypt, Arab Rep.El SalvadorEquatorial GuineaEritreaEstoniaEthiopiaEuro areaEurope & Central AsiaEurope & Central Asia (excluding high income)Europe & Central Asia (IDA & IBRD countries)European UnionFijiFinlandFragile and conflict affected situationsFranceGabonGambia, TheGeorgiaGermanyGhanaGreeceGrenadaGuatemalaGuineaGuinea-BissauGuyanaHaitiHeavily indebted poor countries (HIPC)High incomeHondurasHong Kong SAR, ChinaHungaryIBRD onlyIcelandIDA & IBRD totalIDA blendIDA onlyIDA totalIndiaIndonesiaIran, Islamic Rep.IraqIrelandIsraelItalyJamaicaJapanJordanKazakhstanKenyaKorea, Dem. People’s Rep.Korea, Rep.KuwaitKyrgyz RepublicLao PDRLate-demographic dividendLatin America & Caribbean Latin America & Caribbean (excluding high income)Latin America & the Caribbean (IDA & IBRD countries)LatviaLeast developed countries: UN classificationLebanonLesothoLiberiaLibyaLiechtensteinLithuaniaLow & middle incomeLow incomeLower middle incomeLuxembourgMacao SAR, ChinaMacedonia, FYRMadagascarMalawiMalaysiaMaldivesMaliMaltaMarshall IslandsMauritaniaMauritiusMexicoMicronesia, Fed. Sts.Middle East & North AfricaMiddle East & North Africa (excluding high income)Middle East & North Africa (IDA & IBRD countries)Middle incomeMoldovaMongoliaMontenegroMoroccoMozambiqueMyanmarNamibiaNepalNetherlandsNew ZealandNicaraguaNigerNigeriaNorth AmericaNorwayOECD membersOmanOther small statesPacific island small statesPakistanPalauPanamaPapua New GuineaParaguayPeruPhilippinesPolandPortugalPost-demographic dividendPre-demographic dividendPuerto RicoQatarRomaniaRussian FederationRwandaSamoaSan MarinoSao Tome and PrincipeSaudi ArabiaSenegalSerbiaSeychellesSierra LeoneSingaporeSlovak RepublicSloveniaSmall statesSomaliaSouth AfricaSouth AsiaSouth Asia (IDA & IBRD)SpainSri LankaSt. Kitts and NevisSt. LuciaSt. Vincent and the GrenadinesSub-Saharan Africa Sub-Saharan Africa (excluding high income)Sub-Saharan Africa (IDA & IBRD countries)SudanSurinameSwazilandSwedenSwitzerlandSyrian Arab RepublicTajikistanTanzaniaThailandTimor-LesteTogoTongaTrinidad and TobagoTunisiaTurkeyTurkmenistanUgandaUkraineUnited Arab EmiratesUnited KingdomUnited StatesUpper middle incomeUruguayUzbekistanVanuatuVenezuela, RBVietnamWest Bank and GazaWorldYemen, Rep.ZambiaZimbabwe Timeline:
This timeline shows a graph from 1972 to 2014 of Congo, Dem. Rep.. No data until 1971. Number of actual observations by date: 30.
Source name:
World Development Indicators
Source organization:
UNESCO Institute for Statistics
Categories, topics:
Education
Last updated:
apr 23, 2017
Indicators value changes by year
At the date of observation
Value
Absolute change
Change from previous value
jan 1, 1972
0.665
+0.665
0.0%
jan 1, 1973
0.795
+0.13
19.61%
jan 1, 1974
0.837
+0.042
5.25%
jan 1, 1975
0.938
+0.101
12.02%
jan 1, 1976
1.046
+0.109
11.57%
jan 1, 1977
1.201
+0.155
14.78%
jan 1, 1978
1.203
+0.002
0.16%
jan 1, 1979
1.236
+0.033
2.74%
jan 1, 1980
1.254
+0.019
1.51%
jan 1, 1981
1.142
-0.113
-8.98%
jan 1, 1982
1.181
+0.04
3.47%
jan 1, 1983
1.37
+0.188
15.94%
jan 1, 1984
1.29
-0.08
-5.83%
jan 1, 1985
1.472
+0.182
14.12%
jan 1, 1986
1.442
-0.03
-2.02%
jan 1, 1987
1.481
+0.039
2.71%
jan 1, 1988
1.614
+0.133
8.97%
jan 1, 1989
1.812
+0.198
12.28%
jan 1, 1990
2.047
+0.234
12.93%
jan 1, 1991
2.15
+0.103
5.03%
jan 1, 1992
2.502
+0.352
16.38%
jan 1, 1996
2.519
+0.017
0.68%
jan 1, 2000
1.461
-1.058
-42.02%
jan 1, 2007
4.385
+2.924
200.24%
jan 1, 2008
4.392
+0.007
0.17%
jan 1, 2009
5.505
+1.113
25.33%
jan 1, 2010
6.503
+0.997
18.12%
jan 1, 2012
7.814
+1.312
20.18%
jan 1, 2013
7.922
+0.108
1.38%
jan 1, 2014
6.641
-1.282
-16.18%
Ranking of countries by current statistics by years


Comments: