29
/
en
AIzaSyAYiBZKx7MnpbEhh9jyipgxe19OcubqV5w
April 1, 2024
115846
Cuba
CUB
true
2
1
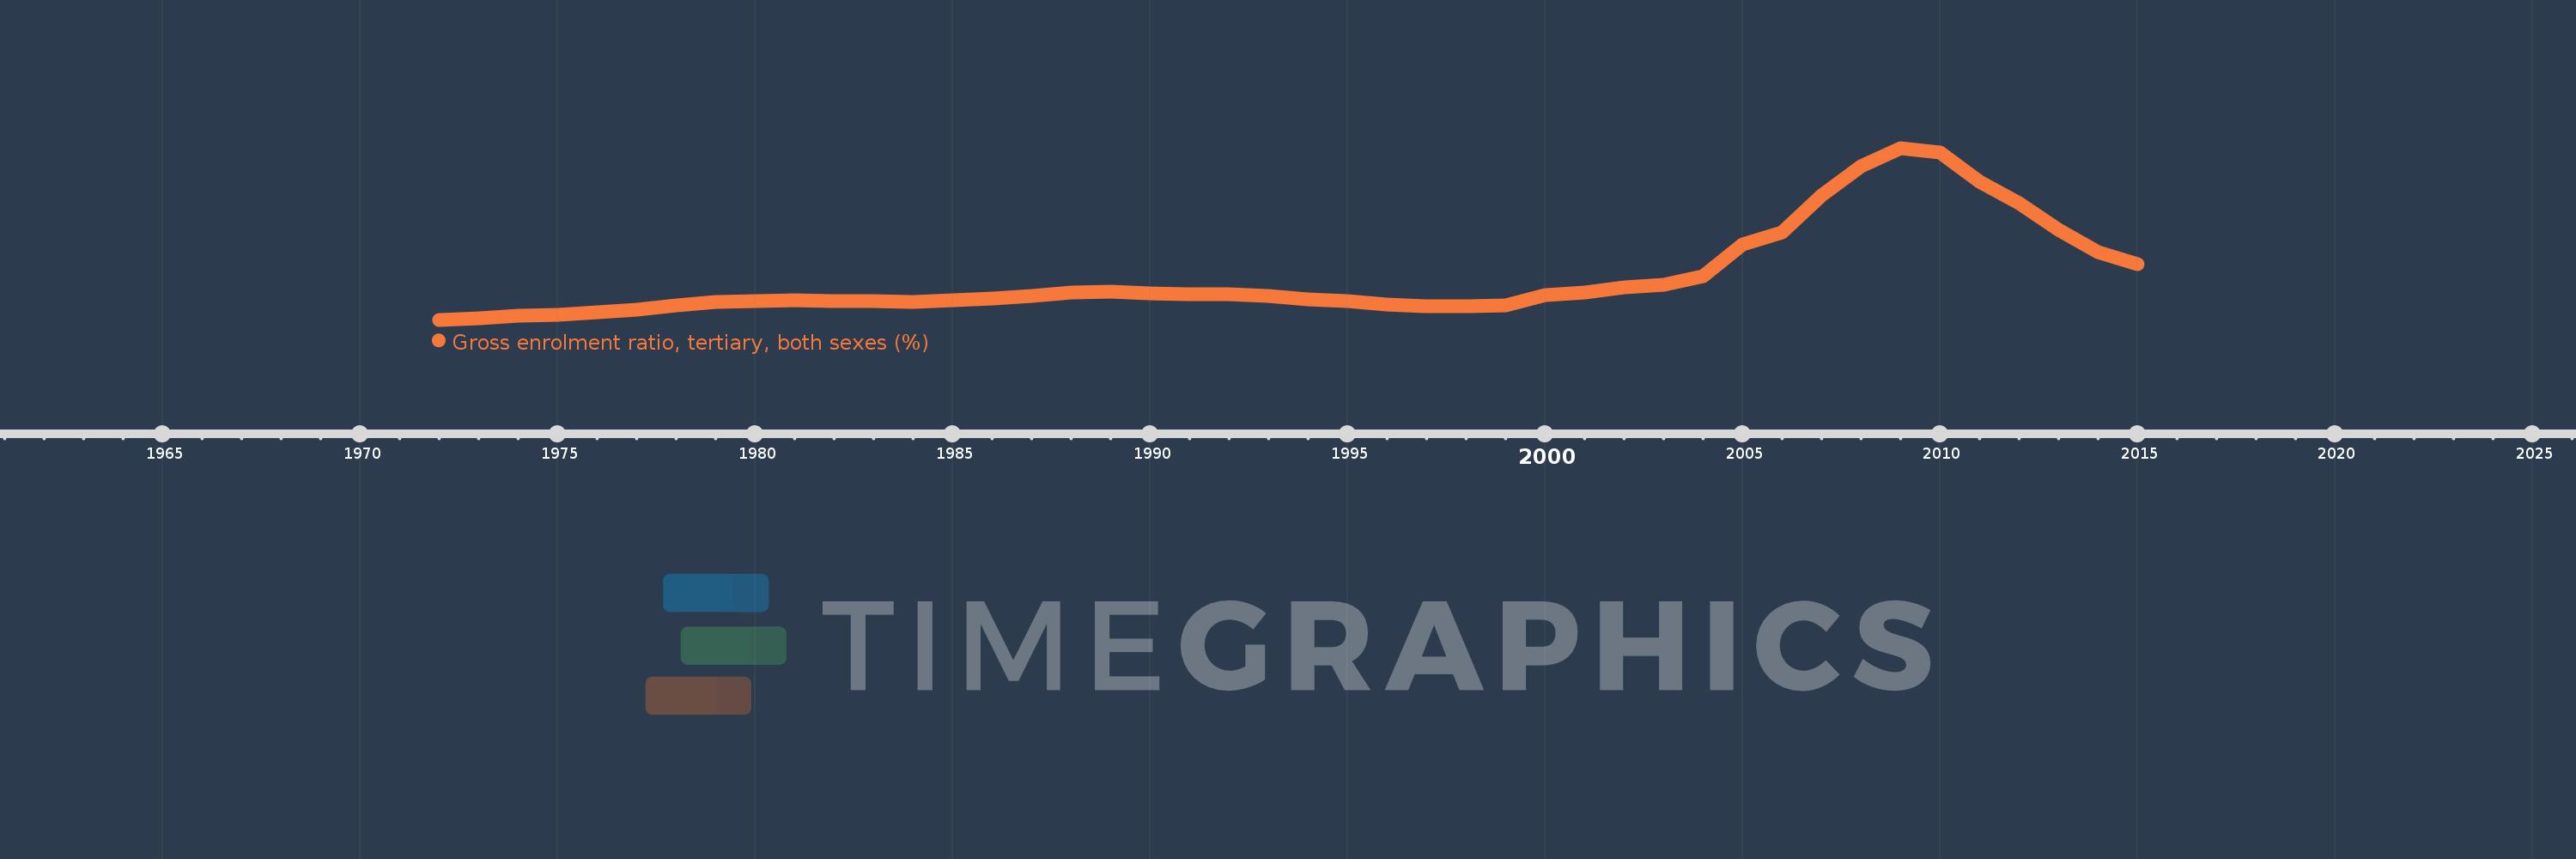
Gross enrolment ratio, tertiary, both sexes (%)
2015,2014,2013,2012,2011,2010,2009,2008,2007,2006,2005,2004,2003,2002,2001,2000,1999,1998,1997,1996,1995,1994,1993,1992,1991,1990,1989,1988,1987,1986,1985,1984,1983,1982,1981,1980,1979,1978,1977,1976,1975,1974,1973,1972
This statistics in other country:
AfghanistanAlbaniaAlgeriaAngolaAntigua and BarbudaArab WorldArgentinaArmeniaArubaAustraliaAustriaAzerbaijanBahamas, TheBahrainBangladeshBarbadosBelarusBelgiumBelizeBeninBermudaBhutanBoliviaBosnia and HerzegovinaBotswanaBrazilBritish Virgin IslandsBrunei DarussalamBulgariaBurkina FasoBurundiCabo VerdeCambodiaCameroonCanadaCaribbean small statesCentral African RepublicCentral Europe and the BalticsChadChileChinaColombiaComorosCongo, Dem. Rep.Congo, Rep.Costa RicaCote d'IvoireCroatiaCubaCuracaoCyprusCzech RepublicDenmarkDjiboutiDominicaDominican RepublicEarly-demographic dividendEast Asia & PacificEast Asia & Pacific (excluding high income)East Asia & Pacific (IDA & IBRD countries)EcuadorEgypt, Arab Rep.El SalvadorEquatorial GuineaEritreaEstoniaEthiopiaEuro areaEurope & Central AsiaEurope & Central Asia (excluding high income)Europe & Central Asia (IDA & IBRD countries)European UnionFijiFinlandFragile and conflict affected situationsFranceGabonGambia, TheGeorgiaGermanyGhanaGreeceGrenadaGuatemalaGuineaGuinea-BissauGuyanaHaitiHeavily indebted poor countries (HIPC)High incomeHondurasHong Kong SAR, ChinaHungaryIBRD onlyIcelandIDA & IBRD totalIDA blendIDA onlyIDA totalIndiaIndonesiaIran, Islamic Rep.IraqIrelandIsraelItalyJamaicaJapanJordanKazakhstanKenyaKorea, Dem. People’s Rep.Korea, Rep.KuwaitKyrgyz RepublicLao PDRLate-demographic dividendLatin America & Caribbean Latin America & Caribbean (excluding high income)Latin America & the Caribbean (IDA & IBRD countries)LatviaLeast developed countries: UN classificationLebanonLesothoLiberiaLibyaLiechtensteinLithuaniaLow & middle incomeLow incomeLower middle incomeLuxembourgMacao SAR, ChinaMacedonia, FYRMadagascarMalawiMalaysiaMaldivesMaliMaltaMarshall IslandsMauritaniaMauritiusMexicoMicronesia, Fed. Sts.Middle East & North AfricaMiddle East & North Africa (excluding high income)Middle East & North Africa (IDA & IBRD countries)Middle incomeMoldovaMongoliaMontenegroMoroccoMozambiqueMyanmarNamibiaNepalNetherlandsNew ZealandNicaraguaNigerNigeriaNorth AmericaNorwayOECD membersOmanOther small statesPacific island small statesPakistanPalauPanamaPapua New GuineaParaguayPeruPhilippinesPolandPortugalPost-demographic dividendPre-demographic dividendPuerto RicoQatarRomaniaRussian FederationRwandaSamoaSan MarinoSao Tome and PrincipeSaudi ArabiaSenegalSerbiaSeychellesSierra LeoneSingaporeSlovak RepublicSloveniaSmall statesSomaliaSouth AfricaSouth AsiaSouth Asia (IDA & IBRD)SpainSri LankaSt. Kitts and NevisSt. LuciaSt. Vincent and the GrenadinesSub-Saharan Africa Sub-Saharan Africa (excluding high income)Sub-Saharan Africa (IDA & IBRD countries)SudanSurinameSwazilandSwedenSwitzerlandSyrian Arab RepublicTajikistanTanzaniaThailandTimor-LesteTogoTongaTrinidad and TobagoTunisiaTurkeyTurkmenistanUgandaUkraineUnited Arab EmiratesUnited KingdomUnited StatesUpper middle incomeUruguayUzbekistanVanuatuVenezuela, RBVietnamWest Bank and GazaWorldYemen, Rep.ZambiaZimbabwe Timeline:
This timeline shows a graph from 1972 to 2015 of Cuba. No data until 1971. Number of actual observations by date: 44.
Source name:
World Development Indicators
Source organization:
UNESCO Institute for Statistics
Categories, topics:
Education
Last updated:
apr 23, 2017
Indicators value changes by year
Maximum:
119.779
jan 1, 2009
At the date of observation
Value
Absolute change
Change from previous value
jan 1, 1972
3.71
+3.71
0.0%
jan 1, 1973
4.98
+1.27
34.24%
jan 1, 1974
6.326
+1.345
27.01%
jan 1, 1975
7.0
+0.674
10.66%
jan 1, 1976
8.48
+1.48
21.15%
jan 1, 1977
10.286
+1.806
21.29%
jan 1, 1978
13.525
+3.239
31.49%
jan 1, 1979
15.657
+2.131
15.76%
jan 1, 1980
16.399
+0.743
4.74%
jan 1, 1981
16.948
+0.549
3.35%
jan 1, 1982
16.174
-0.774
-4.57%
jan 1, 1983
16.114
-0.06
-0.37%
jan 1, 1984
15.75
-0.364
-2.26%
jan 1, 1985
16.806
+1.056
6.7%
jan 1, 1986
18.059
+1.253
7.45%
jan 1, 1987
19.916
+1.857
10.28%
jan 1, 1988
21.948
+2.033
10.21%
jan 1, 1989
22.659
+0.711
3.24%
jan 1, 1990
21.767
-0.892
-3.94%
jan 1, 1991
21.128
-0.639
-2.93%
jan 1, 1992
21.166
+0.038
0.18%
jan 1, 1993
19.719
-1.447
-6.84%
jan 1, 1994
17.731
-1.988
-10.08%
jan 1, 1995
16.309
-1.422
-8.02%
jan 1, 1996
13.747
-2.562
-15.71%
jan 1, 1997
12.876
-0.871
-6.33%
jan 1, 1998
12.829
-0.047
-0.37%
jan 1, 1999
13.125
+0.296
2.31%
jan 1, 2000
20.638
+7.513
57.24%
jan 1, 2001
22.363
+1.724
8.36%
jan 1, 2002
25.58
+3.217
14.39%
jan 1, 2003
27.353
+1.773
6.93%
jan 1, 2004
33.145
+5.792
21.18%
jan 1, 2005
54.395
+21.25
64.11%
jan 1, 2006
62.864
+8.469
15.57%
jan 1, 2007
87.652
+24.788
39.43%
jan 1, 2008
107.447
+19.795
22.58%
jan 1, 2009
119.779
+12.332
11.48%
jan 1, 2010
116.855
-2.923
-2.44%
jan 1, 2011
97.058
-19.797
-16.94%
jan 1, 2012
82.497
-14.561
-15.0%
jan 1, 2013
64.453
-18.044
-21.87%
jan 1, 2014
49.4
-15.053
-23.36%
jan 1, 2015
41.0
-8.4
-17.0%
Ranking of countries by current statistics by years


Comments: