29
/
en
AIzaSyAYiBZKx7MnpbEhh9jyipgxe19OcubqV5w
April 1, 2024
156046
Indonesia
IDN
true
2
1
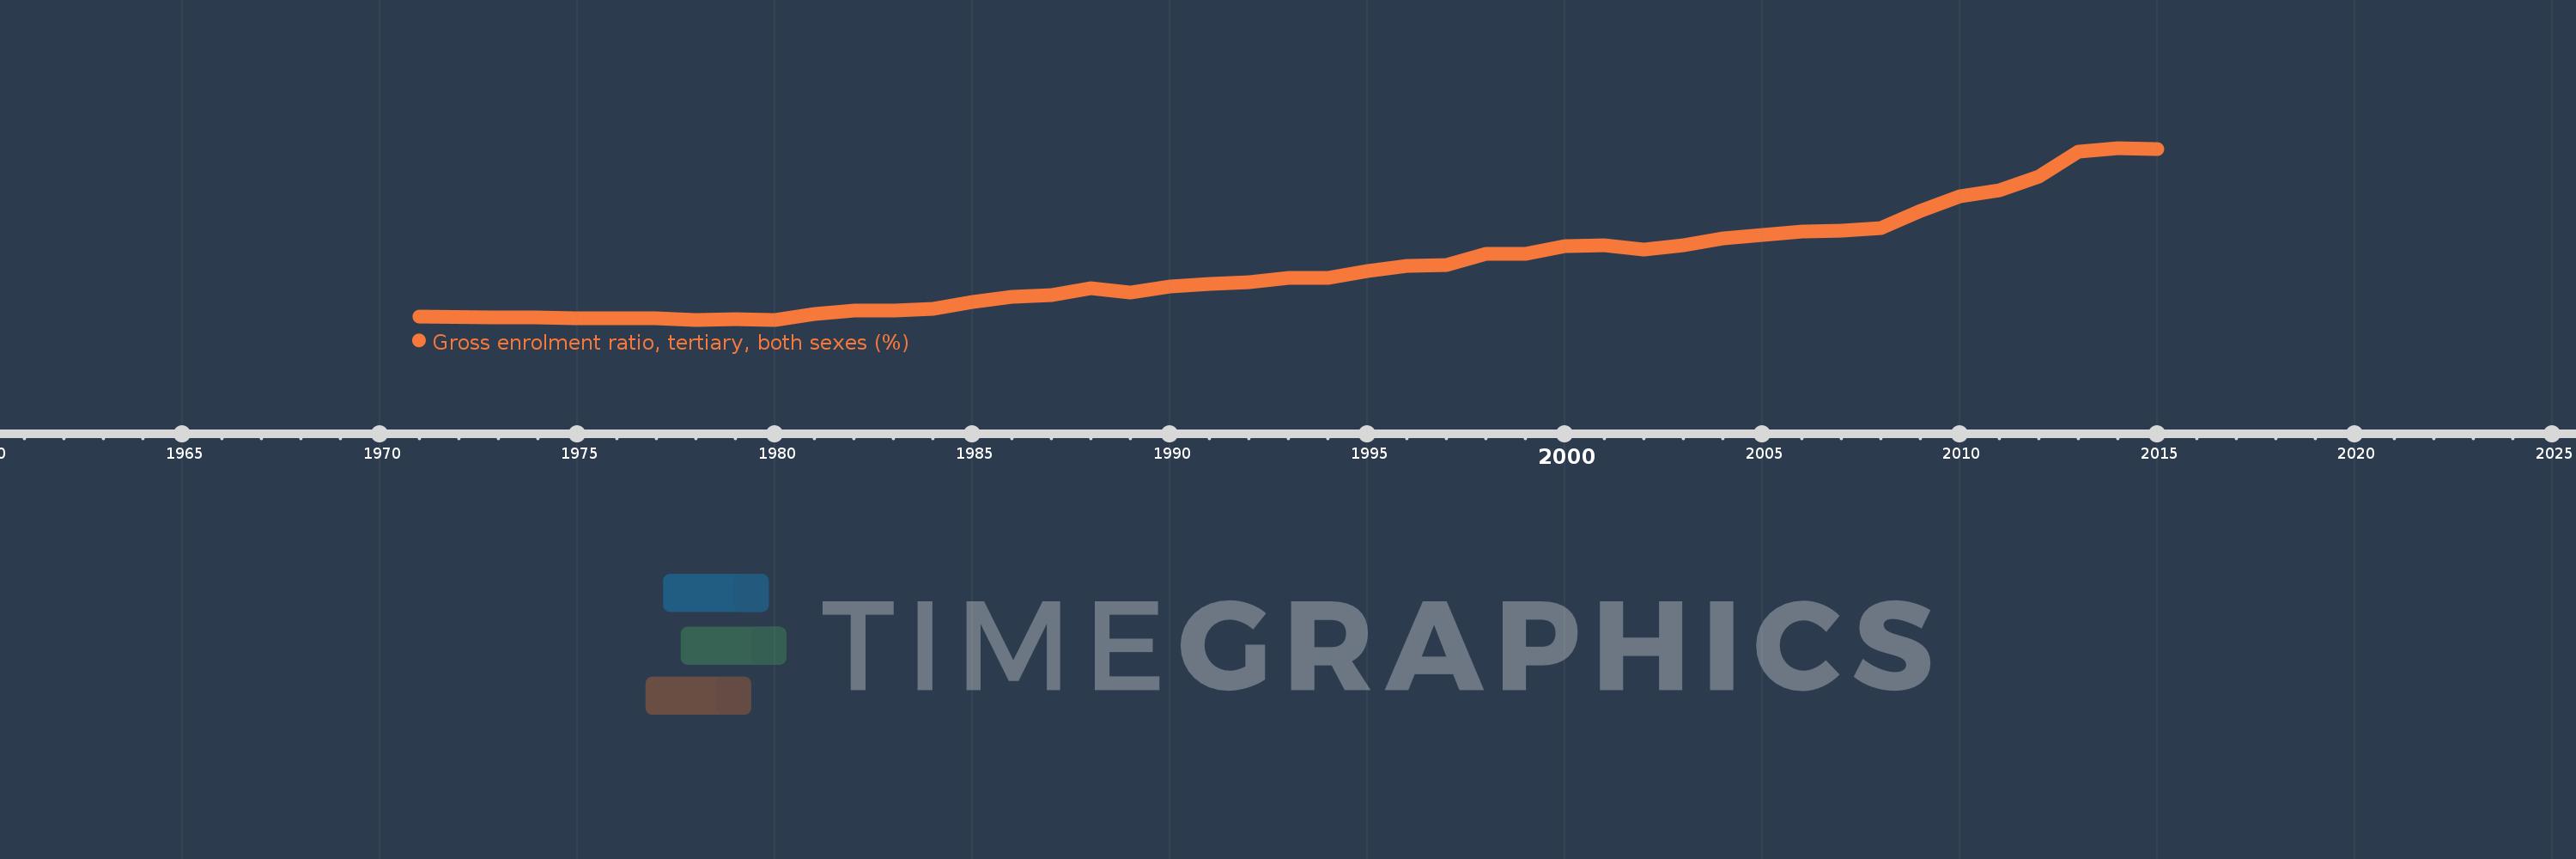
Gross enrolment ratio, tertiary, both sexes (%)
2015,2014,2013,2012,2011,2010,2009,2008,2007,2006,2005,2004,2003,2002,2001,2000,1999,1998,1997,1996,1995,1994,1993,1992,1991,1990,1989,1988,1987,1986,1985,1984,1983,1982,1981,1980,1979,1978,1977,1976,1975,1974,1973,1971
This statistics in other country:
AfghanistanAlbaniaAlgeriaAngolaAntigua and BarbudaArab WorldArgentinaArmeniaArubaAustraliaAustriaAzerbaijanBahamas, TheBahrainBangladeshBarbadosBelarusBelgiumBelizeBeninBermudaBhutanBoliviaBosnia and HerzegovinaBotswanaBrazilBritish Virgin IslandsBrunei DarussalamBulgariaBurkina FasoBurundiCabo VerdeCambodiaCameroonCanadaCaribbean small statesCentral African RepublicCentral Europe and the BalticsChadChileChinaColombiaComorosCongo, Dem. Rep.Congo, Rep.Costa RicaCote d'IvoireCroatiaCubaCuracaoCyprusCzech RepublicDenmarkDjiboutiDominicaDominican RepublicEarly-demographic dividendEast Asia & PacificEast Asia & Pacific (excluding high income)East Asia & Pacific (IDA & IBRD countries)EcuadorEgypt, Arab Rep.El SalvadorEquatorial GuineaEritreaEstoniaEthiopiaEuro areaEurope & Central AsiaEurope & Central Asia (excluding high income)Europe & Central Asia (IDA & IBRD countries)European UnionFijiFinlandFragile and conflict affected situationsFranceGabonGambia, TheGeorgiaGermanyGhanaGreeceGrenadaGuatemalaGuineaGuinea-BissauGuyanaHaitiHeavily indebted poor countries (HIPC)High incomeHondurasHong Kong SAR, ChinaHungaryIBRD onlyIcelandIDA & IBRD totalIDA blendIDA onlyIDA totalIndiaIndonesiaIran, Islamic Rep.IraqIrelandIsraelItalyJamaicaJapanJordanKazakhstanKenyaKorea, Dem. People’s Rep.Korea, Rep.KuwaitKyrgyz RepublicLao PDRLate-demographic dividendLatin America & Caribbean Latin America & Caribbean (excluding high income)Latin America & the Caribbean (IDA & IBRD countries)LatviaLeast developed countries: UN classificationLebanonLesothoLiberiaLibyaLiechtensteinLithuaniaLow & middle incomeLow incomeLower middle incomeLuxembourgMacao SAR, ChinaMacedonia, FYRMadagascarMalawiMalaysiaMaldivesMaliMaltaMarshall IslandsMauritaniaMauritiusMexicoMicronesia, Fed. Sts.Middle East & North AfricaMiddle East & North Africa (excluding high income)Middle East & North Africa (IDA & IBRD countries)Middle incomeMoldovaMongoliaMontenegroMoroccoMozambiqueMyanmarNamibiaNepalNetherlandsNew ZealandNicaraguaNigerNigeriaNorth AmericaNorwayOECD membersOmanOther small statesPacific island small statesPakistanPalauPanamaPapua New GuineaParaguayPeruPhilippinesPolandPortugalPost-demographic dividendPre-demographic dividendPuerto RicoQatarRomaniaRussian FederationRwandaSamoaSan MarinoSao Tome and PrincipeSaudi ArabiaSenegalSerbiaSeychellesSierra LeoneSingaporeSlovak RepublicSloveniaSmall statesSomaliaSouth AfricaSouth AsiaSouth Asia (IDA & IBRD)SpainSri LankaSt. Kitts and NevisSt. LuciaSt. Vincent and the GrenadinesSub-Saharan Africa Sub-Saharan Africa (excluding high income)Sub-Saharan Africa (IDA & IBRD countries)SudanSurinameSwazilandSwedenSwitzerlandSyrian Arab RepublicTajikistanTanzaniaThailandTimor-LesteTogoTongaTrinidad and TobagoTunisiaTurkeyTurkmenistanUgandaUkraineUnited Arab EmiratesUnited KingdomUnited StatesUpper middle incomeUruguayUzbekistanVanuatuVenezuela, RBVietnamWest Bank and GazaWorldYemen, Rep.ZambiaZimbabwe Timeline:
This timeline shows a graph from 1971 to 2015 of Indonesia. No data until 1970. Number of actual observations by date: 44.
Source name:
World Development Indicators
Source organization:
UNESCO Institute for Statistics
Categories, topics:
Education
Last updated:
apr 23, 2017
Indicators value changes by year
Maximum:
31.286
jan 1, 2014
At the date of observation
Value
Absolute change
Change from previous value
jan 1, 1971
2.852
+2.852
0.0%
jan 1, 1973
2.744
-0.108
-3.78%
jan 1, 1974
2.668
-0.076
-2.77%
jan 1, 1975
2.582
-0.086
-3.22%
jan 1, 1976
2.584
+0.001
0.06%
jan 1, 1977
2.614
+0.031
1.18%
jan 1, 1978
2.307
-0.308
-11.77%
jan 1, 1979
2.434
+0.127
5.52%
jan 1, 1980
2.328
-0.106
-4.34%
jan 1, 1981
3.346
+1.017
43.7%
jan 1, 1982
3.826
+0.48
14.36%
jan 1, 1983
3.859
+0.032
0.84%
jan 1, 1984
4.084
+0.226
5.85%
jan 1, 1985
5.361
+1.277
31.27%
jan 1, 1986
6.145
+0.784
14.62%
jan 1, 1987
6.396
+0.251
4.09%
jan 1, 1988
7.59
+1.194
18.66%
jan 1, 1989
6.864
-0.726
-9.57%
jan 1, 1990
7.931
+1.067
15.55%
jan 1, 1991
8.376
+0.445
5.61%
jan 1, 1992
8.613
+0.238
2.84%
jan 1, 1993
9.429
+0.816
9.47%
jan 1, 1994
9.393
-0.036
-0.38%
jan 1, 1995
10.534
+1.141
12.15%
jan 1, 1996
11.332
+0.798
7.57%
jan 1, 1997
11.542
+0.21
1.85%
jan 1, 1998
13.383
+1.842
15.96%
jan 1, 1999
13.359
-0.024
-0.18%
jan 1, 2000
14.749
+1.39
10.4%
jan 1, 2001
14.88
+0.13
0.88%
jan 1, 2002
14.187
-0.692
-4.65%
jan 1, 2003
14.811
+0.624
4.4%
jan 1, 2004
16.028
+1.217
8.22%
jan 1, 2005
16.618
+0.59
3.68%
jan 1, 2006
17.257
+0.638
3.84%
jan 1, 2007
17.313
+0.056
0.33%
jan 1, 2008
17.817
+0.504
2.91%
jan 1, 2009
20.7
+2.884
16.18%
jan 1, 2010
23.057
+2.357
11.39%
jan 1, 2011
24.2
+1.142
4.95%
jan 1, 2012
26.504
+2.305
9.52%
jan 1, 2013
30.656
+4.152
15.67%
jan 1, 2014
31.286
+0.629
2.05%
jan 1, 2015
31.102
-0.183
-0.59%
Ranking of countries by current statistics by years


Comments: