29
/
en
AIzaSyAYiBZKx7MnpbEhh9jyipgxe19OcubqV5w
April 1, 2024
40747
Late-demographic dividend
LTE
false
2
1
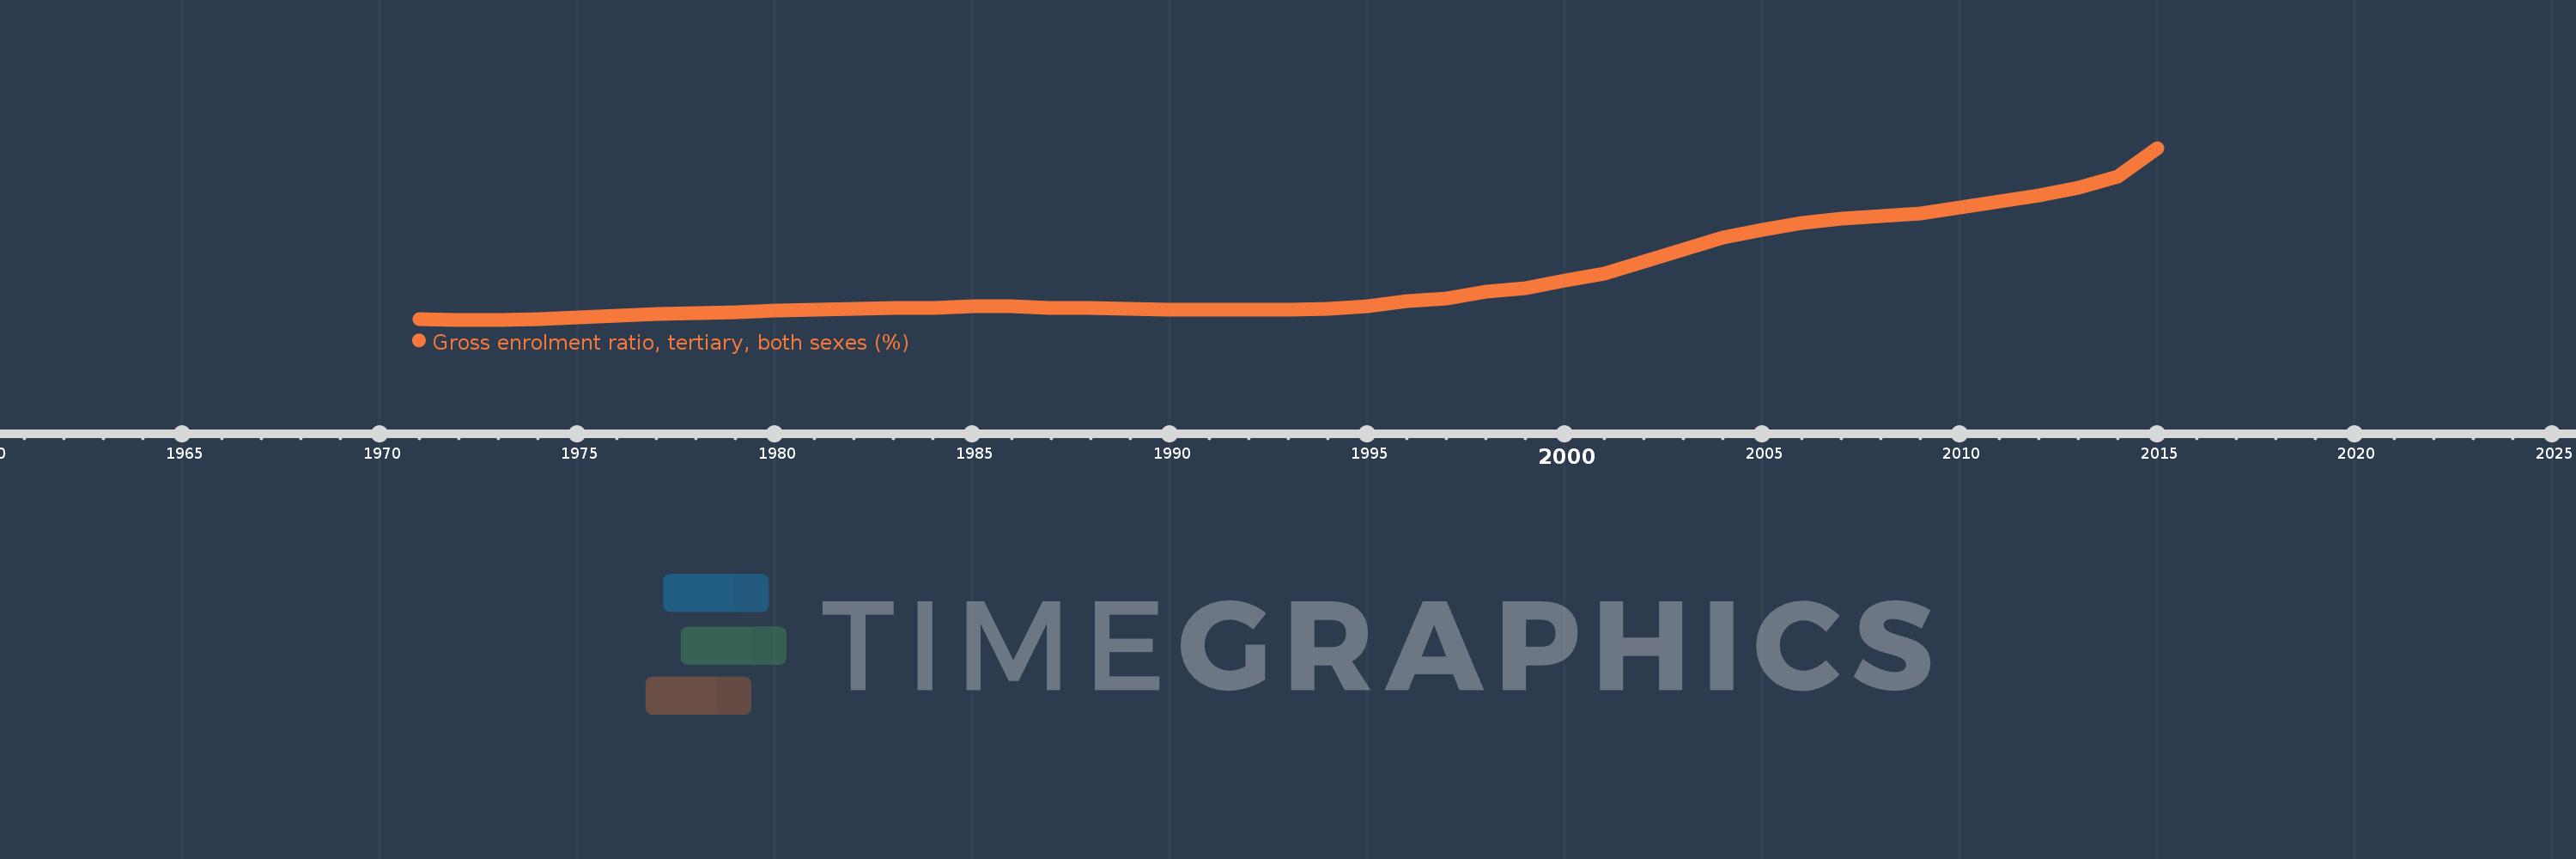
Gross enrolment ratio, tertiary, both sexes (%)
2015,2014,2013,2012,2011,2010,2009,2008,2007,2006,2005,2004,2003,2002,2001,2000,1999,1998,1997,1996,1995,1994,1993,1992,1991,1990,1989,1988,1987,1986,1985,1984,1983,1982,1981,1980,1979,1978,1977,1976,1975,1974,1973,1972,1971
This statistics in other country:
AfghanistanAlbaniaAlgeriaAngolaAntigua and BarbudaArab WorldArgentinaArmeniaArubaAustraliaAustriaAzerbaijanBahamas, TheBahrainBangladeshBarbadosBelarusBelgiumBelizeBeninBermudaBhutanBoliviaBosnia and HerzegovinaBotswanaBrazilBritish Virgin IslandsBrunei DarussalamBulgariaBurkina FasoBurundiCabo VerdeCambodiaCameroonCanadaCaribbean small statesCentral African RepublicCentral Europe and the BalticsChadChileChinaColombiaComorosCongo, Dem. Rep.Congo, Rep.Costa RicaCote d'IvoireCroatiaCubaCuracaoCyprusCzech RepublicDenmarkDjiboutiDominicaDominican RepublicEarly-demographic dividendEast Asia & PacificEast Asia & Pacific (excluding high income)East Asia & Pacific (IDA & IBRD countries)EcuadorEgypt, Arab Rep.El SalvadorEquatorial GuineaEritreaEstoniaEthiopiaEuro areaEurope & Central AsiaEurope & Central Asia (excluding high income)Europe & Central Asia (IDA & IBRD countries)European UnionFijiFinlandFragile and conflict affected situationsFranceGabonGambia, TheGeorgiaGermanyGhanaGreeceGrenadaGuatemalaGuineaGuinea-BissauGuyanaHaitiHeavily indebted poor countries (HIPC)High incomeHondurasHong Kong SAR, ChinaHungaryIBRD onlyIcelandIDA & IBRD totalIDA blendIDA onlyIDA totalIndiaIndonesiaIran, Islamic Rep.IraqIrelandIsraelItalyJamaicaJapanJordanKazakhstanKenyaKorea, Dem. People’s Rep.Korea, Rep.KuwaitKyrgyz RepublicLao PDRLate-demographic dividendLatin America & Caribbean Latin America & Caribbean (excluding high income)Latin America & the Caribbean (IDA & IBRD countries)LatviaLeast developed countries: UN classificationLebanonLesothoLiberiaLibyaLiechtensteinLithuaniaLow & middle incomeLow incomeLower middle incomeLuxembourgMacao SAR, ChinaMacedonia, FYRMadagascarMalawiMalaysiaMaldivesMaliMaltaMarshall IslandsMauritaniaMauritiusMexicoMicronesia, Fed. Sts.Middle East & North AfricaMiddle East & North Africa (excluding high income)Middle East & North Africa (IDA & IBRD countries)Middle incomeMoldovaMongoliaMontenegroMoroccoMozambiqueMyanmarNamibiaNepalNetherlandsNew ZealandNicaraguaNigerNigeriaNorth AmericaNorwayOECD membersOmanOther small statesPacific island small statesPakistanPalauPanamaPapua New GuineaParaguayPeruPhilippinesPolandPortugalPost-demographic dividendPre-demographic dividendPuerto RicoQatarRomaniaRussian FederationRwandaSamoaSan MarinoSao Tome and PrincipeSaudi ArabiaSenegalSerbiaSeychellesSierra LeoneSingaporeSlovak RepublicSloveniaSmall statesSomaliaSouth AfricaSouth AsiaSouth Asia (IDA & IBRD)SpainSri LankaSt. Kitts and NevisSt. LuciaSt. Vincent and the GrenadinesSub-Saharan Africa Sub-Saharan Africa (excluding high income)Sub-Saharan Africa (IDA & IBRD countries)SudanSurinameSwazilandSwedenSwitzerlandSyrian Arab RepublicTajikistanTanzaniaThailandTimor-LesteTogoTongaTrinidad and TobagoTunisiaTurkeyTurkmenistanUgandaUkraineUnited Arab EmiratesUnited KingdomUnited StatesUpper middle incomeUruguayUzbekistanVanuatuVenezuela, RBVietnamWest Bank and GazaWorldYemen, Rep.ZambiaZimbabwe Timeline:
This timeline shows a graph from 1971 to 2015 of Late-demographic dividend. No data until 1970. Number of actual observations by date: 45.
Source name:
World Development Indicators
Source organization:
UNESCO Institute for Statistics
Categories, topics:
Education
Last updated:
apr 23, 2017
Indicators value changes by year
Maximum:
42.678
jan 1, 2015
At the date of observation
Value
Absolute change
Change from previous value
jan 1, 1971
6.661
+6.661
0.0%
jan 1, 1972
6.483
-0.178
-2.67%
jan 1, 1973
6.518
+0.035
0.54%
jan 1, 1974
6.637
+0.119
1.82%
jan 1, 1975
6.991
+0.354
5.34%
jan 1, 1976
7.423
+0.431
6.17%
jan 1, 1977
7.71
+0.287
3.86%
jan 1, 1978
7.945
+0.235
3.05%
jan 1, 1979
8.136
+0.191
2.41%
jan 1, 1980
8.46
+0.324
3.98%
jan 1, 1981
8.563
+0.103
1.22%
jan 1, 1982
8.724
+0.161
1.88%
jan 1, 1983
8.933
+0.208
2.39%
jan 1, 1984
8.927
-0.006
-0.06%
jan 1, 1985
9.288
+0.361
4.05%
jan 1, 1986
9.355
+0.067
0.72%
jan 1, 1987
9.04
-0.315
-3.37%
jan 1, 1988
8.945
-0.095
-1.05%
jan 1, 1989
8.77
-0.175
-1.96%
jan 1, 1990
8.656
-0.114
-1.3%
jan 1, 1991
8.654
-0.002
-0.02%
jan 1, 1992
8.627
-0.027
-0.32%
jan 1, 1993
8.59
-0.037
-0.43%
jan 1, 1994
8.71
+0.121
1.41%
jan 1, 1995
9.329
+0.619
7.11%
jan 1, 1996
10.462
+1.132
12.14%
jan 1, 1997
10.956
+0.494
4.72%
jan 1, 1998
12.417
+1.461
13.34%
jan 1, 1999
13.192
+0.775
6.24%
jan 1, 2000
14.677
+1.485
11.26%
jan 1, 2001
16.177
+1.5
10.22%
jan 1, 2002
18.674
+2.496
15.43%
jan 1, 2003
21.286
+2.612
13.99%
jan 1, 2004
23.747
+2.461
11.56%
jan 1, 2005
25.386
+1.638
6.9%
jan 1, 2006
26.83
+1.444
5.69%
jan 1, 2007
27.774
+0.944
3.52%
jan 1, 2008
28.382
+0.608
2.19%
jan 1, 2009
28.919
+0.537
1.89%
jan 1, 2010
30.107
+1.188
4.11%
jan 1, 2011
31.36
+1.253
4.16%
jan 1, 2012
32.618
+1.258
4.01%
jan 1, 2013
34.37
+1.752
5.37%
jan 1, 2014
36.669
+2.299
6.69%
jan 1, 2015
42.678
+6.01
16.39%
Ranking of countries by current statistics by years


Comments: