29
/
en
AIzaSyAYiBZKx7MnpbEhh9jyipgxe19OcubqV5w
April 1, 2024
272299
Uganda
UGA
true
2
1
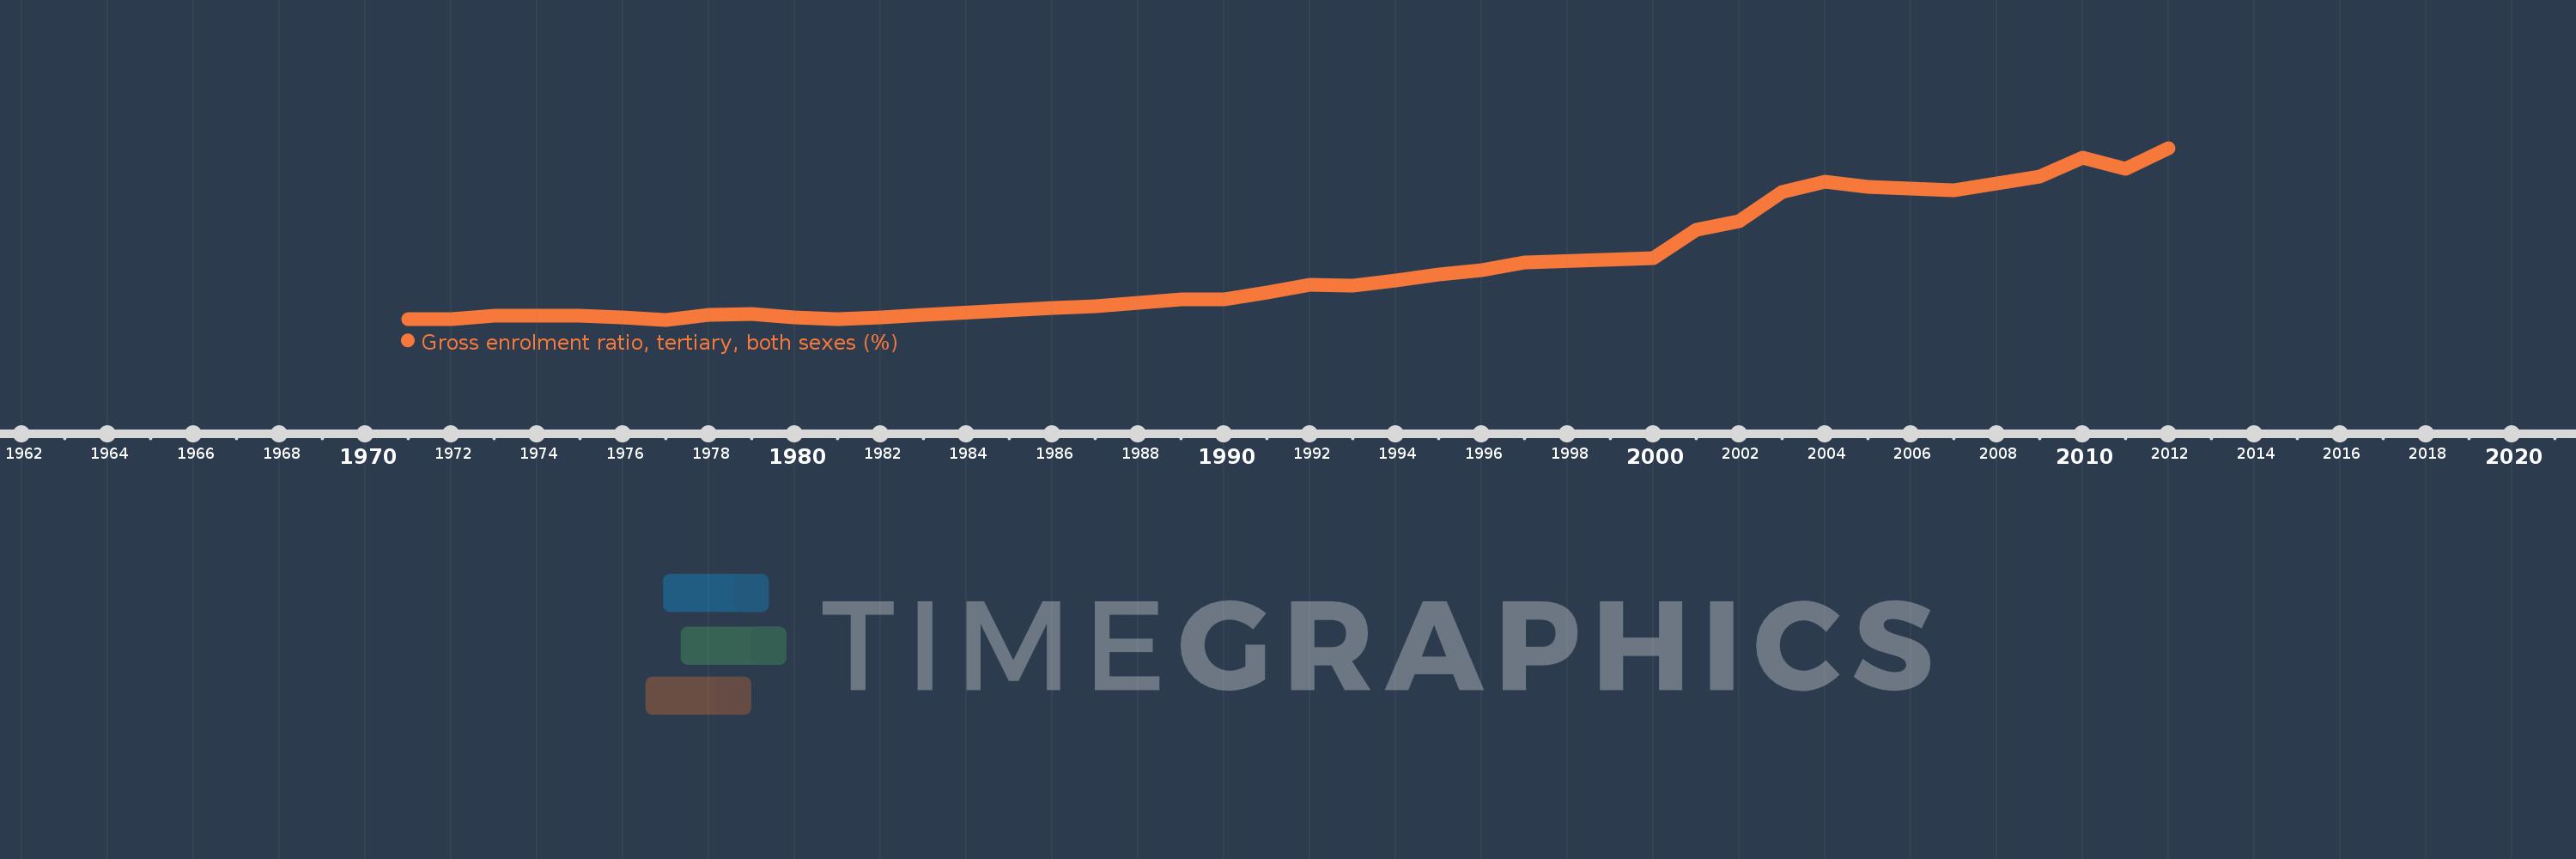
Gross enrolment ratio, tertiary, both sexes (%)
2012,2011,2010,2009,2007,2005,2004,2003,2002,2001,2000,1997,1996,1995,1994,1993,1992,1991,1990,1989,1988,1987,1986,1983,1982,1981,1980,1979,1978,1977,1976,1975,1973,1972,1971
This statistics in other country:
AfghanistanAlbaniaAlgeriaAngolaAntigua and BarbudaArab WorldArgentinaArmeniaArubaAustraliaAustriaAzerbaijanBahamas, TheBahrainBangladeshBarbadosBelarusBelgiumBelizeBeninBermudaBhutanBoliviaBosnia and HerzegovinaBotswanaBrazilBritish Virgin IslandsBrunei DarussalamBulgariaBurkina FasoBurundiCabo VerdeCambodiaCameroonCanadaCaribbean small statesCentral African RepublicCentral Europe and the BalticsChadChileChinaColombiaComorosCongo, Dem. Rep.Congo, Rep.Costa RicaCote d'IvoireCroatiaCubaCuracaoCyprusCzech RepublicDenmarkDjiboutiDominicaDominican RepublicEarly-demographic dividendEast Asia & PacificEast Asia & Pacific (excluding high income)East Asia & Pacific (IDA & IBRD countries)EcuadorEgypt, Arab Rep.El SalvadorEquatorial GuineaEritreaEstoniaEthiopiaEuro areaEurope & Central AsiaEurope & Central Asia (excluding high income)Europe & Central Asia (IDA & IBRD countries)European UnionFijiFinlandFragile and conflict affected situationsFranceGabonGambia, TheGeorgiaGermanyGhanaGreeceGrenadaGuatemalaGuineaGuinea-BissauGuyanaHaitiHeavily indebted poor countries (HIPC)High incomeHondurasHong Kong SAR, ChinaHungaryIBRD onlyIcelandIDA & IBRD totalIDA blendIDA onlyIDA totalIndiaIndonesiaIran, Islamic Rep.IraqIrelandIsraelItalyJamaicaJapanJordanKazakhstanKenyaKorea, Dem. People’s Rep.Korea, Rep.KuwaitKyrgyz RepublicLao PDRLate-demographic dividendLatin America & Caribbean Latin America & Caribbean (excluding high income)Latin America & the Caribbean (IDA & IBRD countries)LatviaLeast developed countries: UN classificationLebanonLesothoLiberiaLibyaLiechtensteinLithuaniaLow & middle incomeLow incomeLower middle incomeLuxembourgMacao SAR, ChinaMacedonia, FYRMadagascarMalawiMalaysiaMaldivesMaliMaltaMarshall IslandsMauritaniaMauritiusMexicoMicronesia, Fed. Sts.Middle East & North AfricaMiddle East & North Africa (excluding high income)Middle East & North Africa (IDA & IBRD countries)Middle incomeMoldovaMongoliaMontenegroMoroccoMozambiqueMyanmarNamibiaNepalNetherlandsNew ZealandNicaraguaNigerNigeriaNorth AmericaNorwayOECD membersOmanOther small statesPacific island small statesPakistanPalauPanamaPapua New GuineaParaguayPeruPhilippinesPolandPortugalPost-demographic dividendPre-demographic dividendPuerto RicoQatarRomaniaRussian FederationRwandaSamoaSan MarinoSao Tome and PrincipeSaudi ArabiaSenegalSerbiaSeychellesSierra LeoneSingaporeSlovak RepublicSloveniaSmall statesSomaliaSouth AfricaSouth AsiaSouth Asia (IDA & IBRD)SpainSri LankaSt. Kitts and NevisSt. LuciaSt. Vincent and the GrenadinesSub-Saharan Africa Sub-Saharan Africa (excluding high income)Sub-Saharan Africa (IDA & IBRD countries)SudanSurinameSwazilandSwedenSwitzerlandSyrian Arab RepublicTajikistanTanzaniaThailandTimor-LesteTogoTongaTrinidad and TobagoTunisiaTurkeyTurkmenistanUgandaUkraineUnited Arab EmiratesUnited KingdomUnited StatesUpper middle incomeUruguayUzbekistanVanuatuVenezuela, RBVietnamWest Bank and GazaWorldYemen, Rep.ZambiaZimbabwe Timeline:
This timeline shows a graph from 1971 to 2012 of Uganda. No data until 1970. Number of actual observations by date: 35.
Source name:
World Development Indicators
Source organization:
UNESCO Institute for Statistics
Categories, topics:
Education
Last updated:
apr 23, 2017
Indicators value changes by year
At the date of observation
Value
Absolute change
Change from previous value
jan 1, 1971
0.536
+0.536
0.0%
jan 1, 1972
0.544
+0.008
1.45%
jan 1, 1973
0.626
+0.082
15.15%
jan 1, 1975
0.614
-0.012
-1.94%
jan 1, 1976
0.58
-0.035
-5.63%
jan 1, 1977
0.529
-0.051
-8.75%
jan 1, 1978
0.632
+0.103
19.47%
jan 1, 1979
0.665
+0.034
5.33%
jan 1, 1980
0.588
-0.078
-11.65%
jan 1, 1981
0.54
-0.048
-8.14%
jan 1, 1982
0.587
+0.047
8.67%
jan 1, 1983
0.635
+0.049
8.27%
jan 1, 1986
0.796
+0.161
25.34%
jan 1, 1987
0.839
+0.042
5.31%
jan 1, 1988
0.919
+0.08
9.55%
jan 1, 1989
1.002
+0.083
9.02%
jan 1, 1990
1.005
+0.003
0.34%
jan 1, 1991
1.149
+0.144
14.3%
jan 1, 1992
1.341
+0.192
16.69%
jan 1, 1993
1.312
-0.029
-2.14%
jan 1, 1994
1.426
+0.114
8.68%
jan 1, 1995
1.577
+0.151
10.57%
jan 1, 1996
1.67
+0.093
5.93%
jan 1, 1997
1.851
+0.181
10.82%
jan 1, 2000
1.956
+0.105
5.67%
jan 1, 2001
2.592
+0.637
32.55%
jan 1, 2002
2.805
+0.213
8.21%
jan 1, 2003
3.467
+0.662
23.6%
jan 1, 2004
3.703
+0.236
6.79%
jan 1, 2005
3.579
-0.124
-3.35%
jan 1, 2007
3.499
-0.08
-2.23%
jan 1, 2009
3.825
+0.326
9.32%
jan 1, 2010
4.255
+0.429
11.23%
jan 1, 2011
4.002
-0.253
-5.95%
jan 1, 2012
4.483
+0.482
12.04%
Ranking of countries by current statistics by years


Comments: