29
/
en
AIzaSyAYiBZKx7MnpbEhh9jyipgxe19OcubqV5w
April 1, 2024
51893
North America
NAC
false
2
1
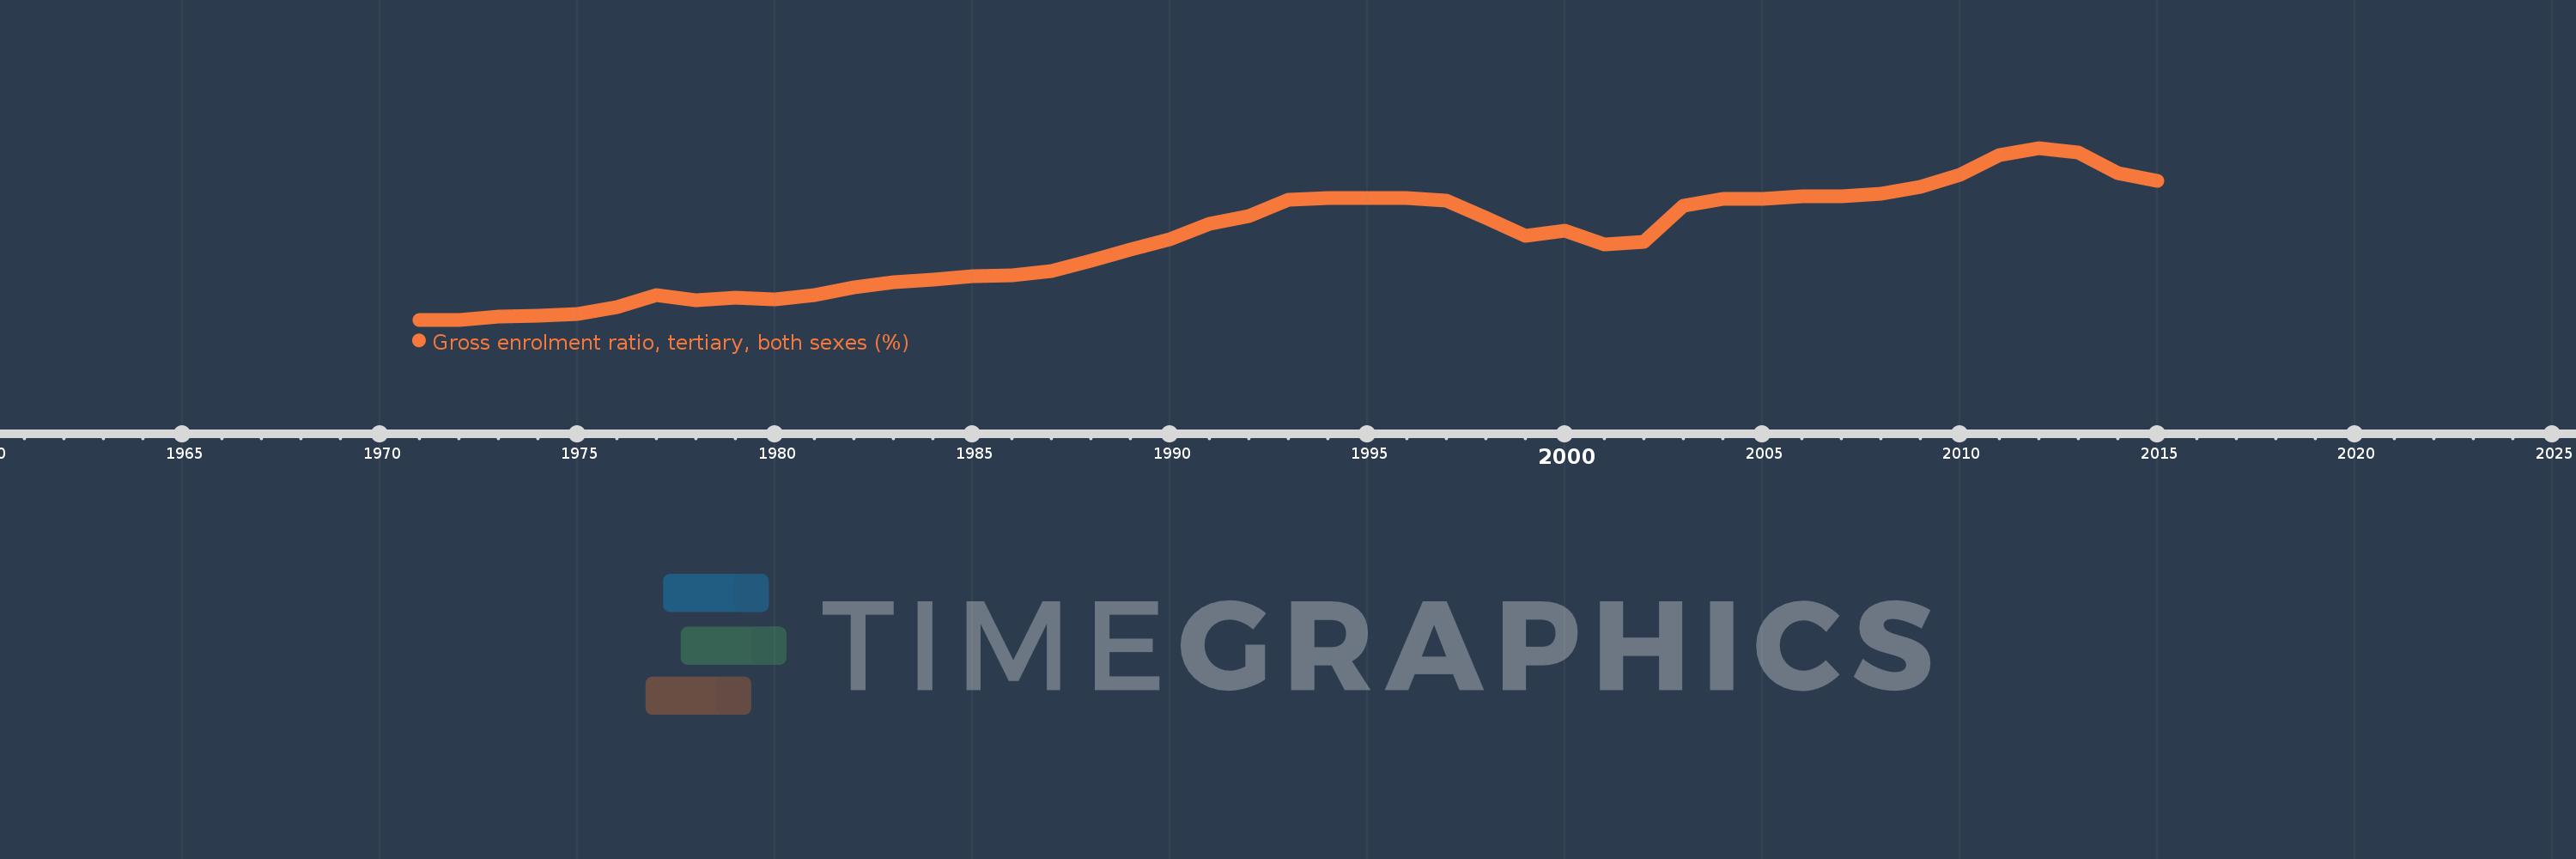
Gross enrolment ratio, tertiary, both sexes (%)
2015,2014,2013,2012,2011,2010,2009,2008,2007,2006,2005,2004,2003,2002,2001,2000,1999,1998,1997,1996,1995,1994,1993,1992,1991,1990,1989,1988,1987,1986,1985,1984,1983,1982,1981,1980,1979,1978,1977,1976,1975,1974,1973,1972,1971
This statistics in other country:
AfghanistanAlbaniaAlgeriaAngolaAntigua and BarbudaArab WorldArgentinaArmeniaArubaAustraliaAustriaAzerbaijanBahamas, TheBahrainBangladeshBarbadosBelarusBelgiumBelizeBeninBermudaBhutanBoliviaBosnia and HerzegovinaBotswanaBrazilBritish Virgin IslandsBrunei DarussalamBulgariaBurkina FasoBurundiCabo VerdeCambodiaCameroonCanadaCaribbean small statesCentral African RepublicCentral Europe and the BalticsChadChileChinaColombiaComorosCongo, Dem. Rep.Congo, Rep.Costa RicaCote d'IvoireCroatiaCubaCuracaoCyprusCzech RepublicDenmarkDjiboutiDominicaDominican RepublicEarly-demographic dividendEast Asia & PacificEast Asia & Pacific (excluding high income)East Asia & Pacific (IDA & IBRD countries)EcuadorEgypt, Arab Rep.El SalvadorEquatorial GuineaEritreaEstoniaEthiopiaEuro areaEurope & Central AsiaEurope & Central Asia (excluding high income)Europe & Central Asia (IDA & IBRD countries)European UnionFijiFinlandFragile and conflict affected situationsFranceGabonGambia, TheGeorgiaGermanyGhanaGreeceGrenadaGuatemalaGuineaGuinea-BissauGuyanaHaitiHeavily indebted poor countries (HIPC)High incomeHondurasHong Kong SAR, ChinaHungaryIBRD onlyIcelandIDA & IBRD totalIDA blendIDA onlyIDA totalIndiaIndonesiaIran, Islamic Rep.IraqIrelandIsraelItalyJamaicaJapanJordanKazakhstanKenyaKorea, Dem. People’s Rep.Korea, Rep.KuwaitKyrgyz RepublicLao PDRLate-demographic dividendLatin America & Caribbean Latin America & Caribbean (excluding high income)Latin America & the Caribbean (IDA & IBRD countries)LatviaLeast developed countries: UN classificationLebanonLesothoLiberiaLibyaLiechtensteinLithuaniaLow & middle incomeLow incomeLower middle incomeLuxembourgMacao SAR, ChinaMacedonia, FYRMadagascarMalawiMalaysiaMaldivesMaliMaltaMarshall IslandsMauritaniaMauritiusMexicoMicronesia, Fed. Sts.Middle East & North AfricaMiddle East & North Africa (excluding high income)Middle East & North Africa (IDA & IBRD countries)Middle incomeMoldovaMongoliaMontenegroMoroccoMozambiqueMyanmarNamibiaNepalNetherlandsNew ZealandNicaraguaNigerNigeriaNorth AmericaNorwayOECD membersOmanOther small statesPacific island small statesPakistanPalauPanamaPapua New GuineaParaguayPeruPhilippinesPolandPortugalPost-demographic dividendPre-demographic dividendPuerto RicoQatarRomaniaRussian FederationRwandaSamoaSan MarinoSao Tome and PrincipeSaudi ArabiaSenegalSerbiaSeychellesSierra LeoneSingaporeSlovak RepublicSloveniaSmall statesSomaliaSouth AfricaSouth AsiaSouth Asia (IDA & IBRD)SpainSri LankaSt. Kitts and NevisSt. LuciaSt. Vincent and the GrenadinesSub-Saharan Africa Sub-Saharan Africa (excluding high income)Sub-Saharan Africa (IDA & IBRD countries)SudanSurinameSwazilandSwedenSwitzerlandSyrian Arab RepublicTajikistanTanzaniaThailandTimor-LesteTogoTongaTrinidad and TobagoTunisiaTurkeyTurkmenistanUgandaUkraineUnited Arab EmiratesUnited KingdomUnited StatesUpper middle incomeUruguayUzbekistanVanuatuVenezuela, RBVietnamWest Bank and GazaWorldYemen, Rep.ZambiaZimbabwe Timeline:
This timeline shows a graph from 1971 to 2015 of North America. No data until 1970. Number of actual observations by date: 45.
Source name:
World Development Indicators
Source organization:
UNESCO Institute for Statistics
Categories, topics:
Education
Last updated:
apr 23, 2017
Indicators value changes by year
Minimum:
47.371
jan 1, 1971
Maximum:
92.701
jan 1, 2012
At the date of observation
Value
Absolute change
Change from previous value
jan 1, 1971
47.371
+47.371
0.0%
jan 1, 1972
47.372
+0.001
0.0%
jan 1, 1973
48.131
+0.759
1.6%
jan 1, 1974
48.544
+0.413
0.86%
jan 1, 1975
48.866
+0.321
0.66%
jan 1, 1976
50.69
+1.825
3.73%
jan 1, 1977
53.988
+3.298
6.51%
jan 1, 1978
52.561
-1.427
-2.64%
jan 1, 1979
53.189
+0.628
1.2%
jan 1, 1980
52.707
-0.483
-0.91%
jan 1, 1981
53.783
+1.076
2.04%
jan 1, 1982
55.876
+2.093
3.89%
jan 1, 1983
57.224
+1.348
2.41%
jan 1, 1984
57.955
+0.731
1.28%
jan 1, 1985
58.913
+0.958
1.65%
jan 1, 1986
59.012
+0.098
0.17%
jan 1, 1987
60.278
+1.266
2.15%
jan 1, 1988
63.053
+2.775
4.6%
jan 1, 1989
65.845
+2.792
4.43%
jan 1, 1990
68.665
+2.82
4.28%
jan 1, 1991
72.605
+3.94
5.74%
jan 1, 1992
74.706
+2.101
2.89%
jan 1, 1993
79.014
+4.307
5.77%
jan 1, 1994
79.556
+0.542
0.69%
jan 1, 1995
79.402
-0.154
-0.19%
jan 1, 1996
79.448
+0.046
0.06%
jan 1, 1997
78.841
-0.607
-0.76%
jan 1, 1998
74.174
-4.667
-5.92%
jan 1, 1999
69.519
-4.655
-6.28%
jan 1, 2000
70.983
+1.464
2.11%
jan 1, 2001
67.241
-3.742
-5.27%
jan 1, 2002
68.007
+0.767
1.14%
jan 1, 2003
77.376
+9.369
13.78%
jan 1, 2004
79.174
+1.798
2.32%
jan 1, 2005
79.316
+0.141
0.18%
jan 1, 2006
79.884
+0.568
0.72%
jan 1, 2007
79.865
-0.019
-0.02%
jan 1, 2008
80.733
+0.869
1.09%
jan 1, 2009
82.503
+1.77
2.19%
jan 1, 2010
85.719
+3.216
3.9%
jan 1, 2011
90.809
+5.089
5.94%
jan 1, 2012
92.701
+1.893
2.08%
jan 1, 2013
91.388
-1.313
-1.42%
jan 1, 2014
85.947
-5.441
-5.95%
jan 1, 2015
84.032
-1.914
-2.23%
Ranking of countries by current statistics by years


Comments: