29
/
en
AIzaSyAYiBZKx7MnpbEhh9jyipgxe19OcubqV5w
April 1, 2024
55564
Pre-demographic dividend
PRE
false
2
1
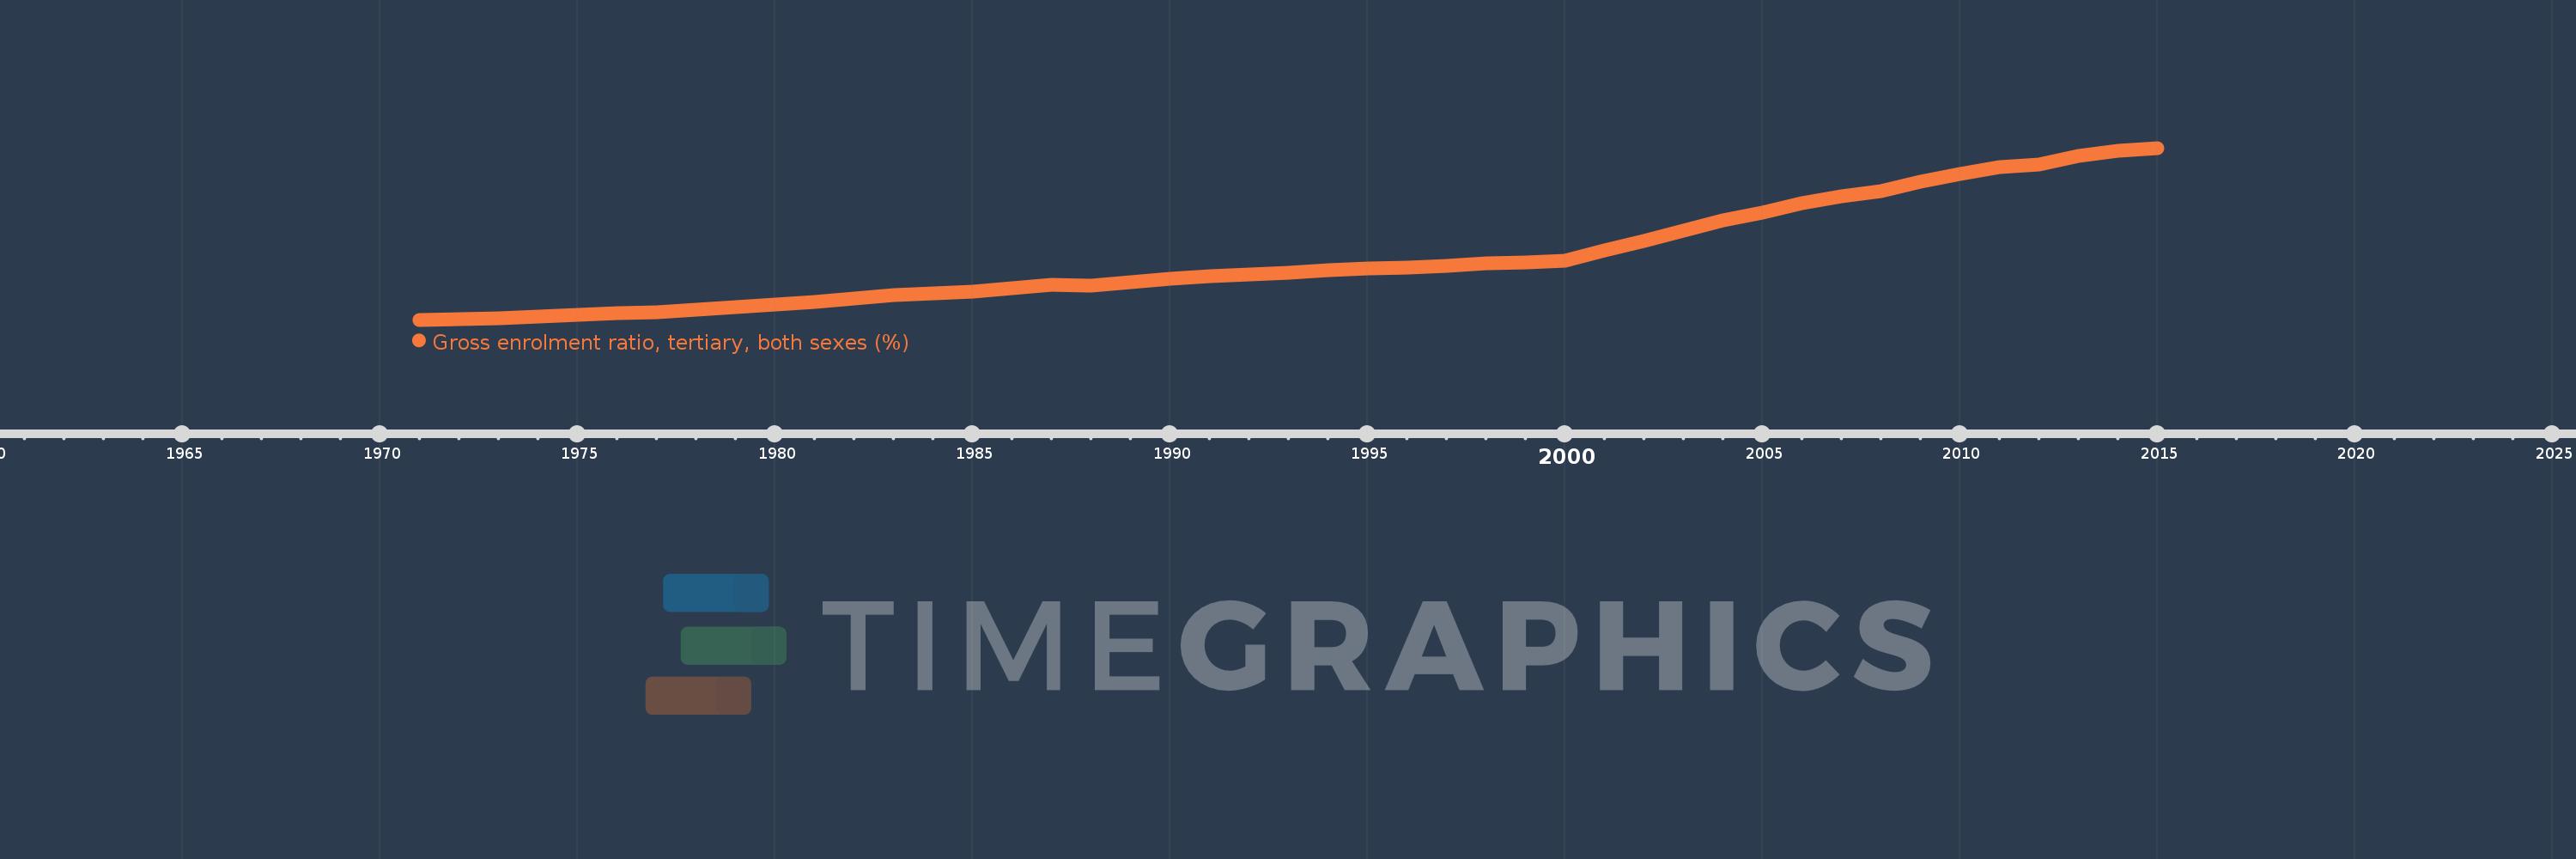
Gross enrolment ratio, tertiary, both sexes (%)
2015,2014,2013,2012,2011,2010,2009,2008,2007,2006,2005,2004,2003,2002,2001,2000,1999,1998,1997,1996,1995,1994,1993,1992,1991,1990,1989,1988,1987,1986,1985,1984,1983,1982,1981,1980,1979,1978,1977,1976,1975,1974,1973,1972,1971
This statistics in other country:
AfghanistanAlbaniaAlgeriaAngolaAntigua and BarbudaArab WorldArgentinaArmeniaArubaAustraliaAustriaAzerbaijanBahamas, TheBahrainBangladeshBarbadosBelarusBelgiumBelizeBeninBermudaBhutanBoliviaBosnia and HerzegovinaBotswanaBrazilBritish Virgin IslandsBrunei DarussalamBulgariaBurkina FasoBurundiCabo VerdeCambodiaCameroonCanadaCaribbean small statesCentral African RepublicCentral Europe and the BalticsChadChileChinaColombiaComorosCongo, Dem. Rep.Congo, Rep.Costa RicaCote d'IvoireCroatiaCubaCuracaoCyprusCzech RepublicDenmarkDjiboutiDominicaDominican RepublicEarly-demographic dividendEast Asia & PacificEast Asia & Pacific (excluding high income)East Asia & Pacific (IDA & IBRD countries)EcuadorEgypt, Arab Rep.El SalvadorEquatorial GuineaEritreaEstoniaEthiopiaEuro areaEurope & Central AsiaEurope & Central Asia (excluding high income)Europe & Central Asia (IDA & IBRD countries)European UnionFijiFinlandFragile and conflict affected situationsFranceGabonGambia, TheGeorgiaGermanyGhanaGreeceGrenadaGuatemalaGuineaGuinea-BissauGuyanaHaitiHeavily indebted poor countries (HIPC)High incomeHondurasHong Kong SAR, ChinaHungaryIBRD onlyIcelandIDA & IBRD totalIDA blendIDA onlyIDA totalIndiaIndonesiaIran, Islamic Rep.IraqIrelandIsraelItalyJamaicaJapanJordanKazakhstanKenyaKorea, Dem. People’s Rep.Korea, Rep.KuwaitKyrgyz RepublicLao PDRLate-demographic dividendLatin America & Caribbean Latin America & Caribbean (excluding high income)Latin America & the Caribbean (IDA & IBRD countries)LatviaLeast developed countries: UN classificationLebanonLesothoLiberiaLibyaLiechtensteinLithuaniaLow & middle incomeLow incomeLower middle incomeLuxembourgMacao SAR, ChinaMacedonia, FYRMadagascarMalawiMalaysiaMaldivesMaliMaltaMarshall IslandsMauritaniaMauritiusMexicoMicronesia, Fed. Sts.Middle East & North AfricaMiddle East & North Africa (excluding high income)Middle East & North Africa (IDA & IBRD countries)Middle incomeMoldovaMongoliaMontenegroMoroccoMozambiqueMyanmarNamibiaNepalNetherlandsNew ZealandNicaraguaNigerNigeriaNorth AmericaNorwayOECD membersOmanOther small statesPacific island small statesPakistanPalauPanamaPapua New GuineaParaguayPeruPhilippinesPolandPortugalPost-demographic dividendPre-demographic dividendPuerto RicoQatarRomaniaRussian FederationRwandaSamoaSan MarinoSao Tome and PrincipeSaudi ArabiaSenegalSerbiaSeychellesSierra LeoneSingaporeSlovak RepublicSloveniaSmall statesSomaliaSouth AfricaSouth AsiaSouth Asia (IDA & IBRD)SpainSri LankaSt. Kitts and NevisSt. LuciaSt. Vincent and the GrenadinesSub-Saharan Africa Sub-Saharan Africa (excluding high income)Sub-Saharan Africa (IDA & IBRD countries)SudanSurinameSwazilandSwedenSwitzerlandSyrian Arab RepublicTajikistanTanzaniaThailandTimor-LesteTogoTongaTrinidad and TobagoTunisiaTurkeyTurkmenistanUgandaUkraineUnited Arab EmiratesUnited KingdomUnited StatesUpper middle incomeUruguayUzbekistanVanuatuVenezuela, RBVietnamWest Bank and GazaWorldYemen, Rep.ZambiaZimbabwe Timeline:
This timeline shows a graph from 1971 to 2015 of Pre-demographic dividend. No data until 1970. Number of actual observations by date: 45.
Source name:
World Development Indicators
Source organization:
UNESCO Institute for Statistics
Categories, topics:
Education
Last updated:
apr 23, 2017
Indicators value changes by year
At the date of observation
Value
Absolute change
Change from previous value
jan 1, 1971
1.44
+1.44
0.0%
jan 1, 1972
1.458
+0.018
1.22%
jan 1, 1973
1.503
+0.045
3.1%
jan 1, 1974
1.564
+0.061
4.08%
jan 1, 1975
1.619
+0.055
3.49%
jan 1, 1976
1.684
+0.065
4.01%
jan 1, 1977
1.737
+0.054
3.19%
jan 1, 1978
1.818
+0.081
4.65%
jan 1, 1979
1.904
+0.086
4.71%
jan 1, 1980
2.015
+0.111
5.83%
jan 1, 1981
2.115
+0.1
4.98%
jan 1, 1982
2.243
+0.128
6.05%
jan 1, 1983
2.366
+0.123
5.49%
jan 1, 1984
2.432
+0.065
2.76%
jan 1, 1985
2.489
+0.057
2.36%
jan 1, 1986
2.638
+0.149
5.99%
jan 1, 1987
2.773
+0.135
5.1%
jan 1, 1988
2.735
-0.038
-1.35%
jan 1, 1989
2.872
+0.137
5.02%
jan 1, 1990
3.001
+0.129
4.48%
jan 1, 1991
3.078
+0.077
2.58%
jan 1, 1992
3.165
+0.087
2.82%
jan 1, 1993
3.231
+0.066
2.08%
jan 1, 1994
3.32
+0.089
2.76%
jan 1, 1995
3.381
+0.06
1.81%
jan 1, 1996
3.425
+0.045
1.32%
jan 1, 1997
3.492
+0.067
1.94%
jan 1, 1998
3.566
+0.075
2.14%
jan 1, 1999
3.608
+0.042
1.17%
jan 1, 2000
3.662
+0.054
1.51%
jan 1, 2001
4.062
+0.4
10.92%
jan 1, 2002
4.442
+0.38
9.35%
jan 1, 2003
4.82
+0.378
8.51%
jan 1, 2004
5.214
+0.394
8.18%
jan 1, 2005
5.503
+0.289
5.54%
jan 1, 2006
5.849
+0.346
6.29%
jan 1, 2007
6.119
+0.27
4.62%
jan 1, 2008
6.322
+0.203
3.31%
jan 1, 2009
6.666
+0.344
5.44%
jan 1, 2010
6.965
+0.299
4.48%
jan 1, 2011
7.213
+0.248
3.57%
jan 1, 2012
7.323
+0.11
1.53%
jan 1, 2013
7.644
+0.321
4.38%
jan 1, 2014
7.844
+0.2
2.62%
jan 1, 2015
7.954
+0.11
1.4%
Ranking of countries by current statistics by years


Comments: