29
/
en
AIzaSyAYiBZKx7MnpbEhh9jyipgxe19OcubqV5w
April 1, 2024
27328
East Asia & Pacific
EAS
false
2
1
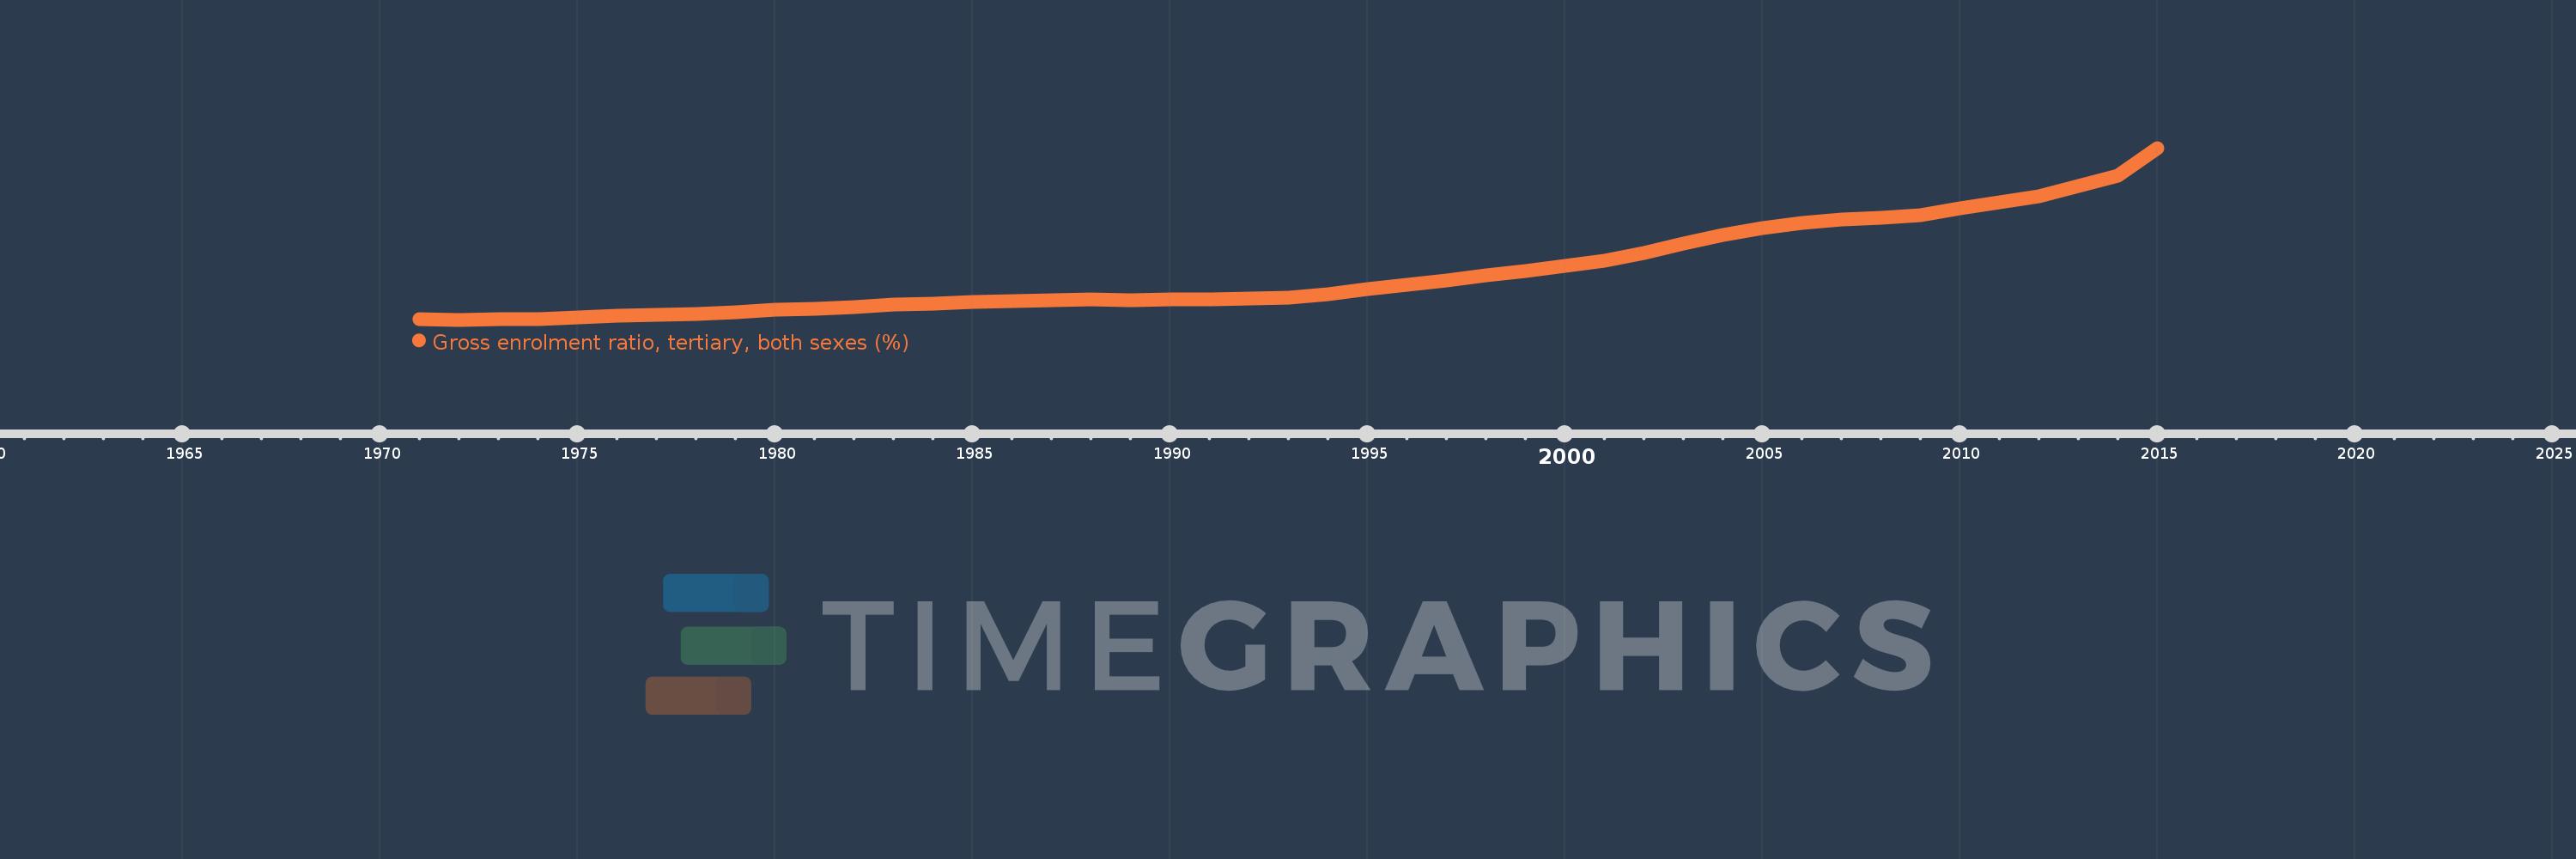
Gross enrolment ratio, tertiary, both sexes (%)
2015,2014,2013,2012,2011,2010,2009,2008,2007,2006,2005,2004,2003,2002,2001,2000,1999,1998,1997,1996,1995,1994,1993,1992,1991,1990,1989,1988,1987,1986,1985,1984,1983,1982,1981,1980,1979,1978,1977,1976,1975,1974,1973,1972,1971
This statistics in other country:
AfghanistanAlbaniaAlgeriaAngolaAntigua and BarbudaArab WorldArgentinaArmeniaArubaAustraliaAustriaAzerbaijanBahamas, TheBahrainBangladeshBarbadosBelarusBelgiumBelizeBeninBermudaBhutanBoliviaBosnia and HerzegovinaBotswanaBrazilBritish Virgin IslandsBrunei DarussalamBulgariaBurkina FasoBurundiCabo VerdeCambodiaCameroonCanadaCaribbean small statesCentral African RepublicCentral Europe and the BalticsChadChileChinaColombiaComorosCongo, Dem. Rep.Congo, Rep.Costa RicaCote d'IvoireCroatiaCubaCuracaoCyprusCzech RepublicDenmarkDjiboutiDominicaDominican RepublicEarly-demographic dividendEast Asia & PacificEast Asia & Pacific (excluding high income)East Asia & Pacific (IDA & IBRD countries)EcuadorEgypt, Arab Rep.El SalvadorEquatorial GuineaEritreaEstoniaEthiopiaEuro areaEurope & Central AsiaEurope & Central Asia (excluding high income)Europe & Central Asia (IDA & IBRD countries)European UnionFijiFinlandFragile and conflict affected situationsFranceGabonGambia, TheGeorgiaGermanyGhanaGreeceGrenadaGuatemalaGuineaGuinea-BissauGuyanaHaitiHeavily indebted poor countries (HIPC)High incomeHondurasHong Kong SAR, ChinaHungaryIBRD onlyIcelandIDA & IBRD totalIDA blendIDA onlyIDA totalIndiaIndonesiaIran, Islamic Rep.IraqIrelandIsraelItalyJamaicaJapanJordanKazakhstanKenyaKorea, Dem. People’s Rep.Korea, Rep.KuwaitKyrgyz RepublicLao PDRLate-demographic dividendLatin America & Caribbean Latin America & Caribbean (excluding high income)Latin America & the Caribbean (IDA & IBRD countries)LatviaLeast developed countries: UN classificationLebanonLesothoLiberiaLibyaLiechtensteinLithuaniaLow & middle incomeLow incomeLower middle incomeLuxembourgMacao SAR, ChinaMacedonia, FYRMadagascarMalawiMalaysiaMaldivesMaliMaltaMarshall IslandsMauritaniaMauritiusMexicoMicronesia, Fed. Sts.Middle East & North AfricaMiddle East & North Africa (excluding high income)Middle East & North Africa (IDA & IBRD countries)Middle incomeMoldovaMongoliaMontenegroMoroccoMozambiqueMyanmarNamibiaNepalNetherlandsNew ZealandNicaraguaNigerNigeriaNorth AmericaNorwayOECD membersOmanOther small statesPacific island small statesPakistanPalauPanamaPapua New GuineaParaguayPeruPhilippinesPolandPortugalPost-demographic dividendPre-demographic dividendPuerto RicoQatarRomaniaRussian FederationRwandaSamoaSan MarinoSao Tome and PrincipeSaudi ArabiaSenegalSerbiaSeychellesSierra LeoneSingaporeSlovak RepublicSloveniaSmall statesSomaliaSouth AfricaSouth AsiaSouth Asia (IDA & IBRD)SpainSri LankaSt. Kitts and NevisSt. LuciaSt. Vincent and the GrenadinesSub-Saharan Africa Sub-Saharan Africa (excluding high income)Sub-Saharan Africa (IDA & IBRD countries)SudanSurinameSwazilandSwedenSwitzerlandSyrian Arab RepublicTajikistanTanzaniaThailandTimor-LesteTogoTongaTrinidad and TobagoTunisiaTurkeyTurkmenistanUgandaUkraineUnited Arab EmiratesUnited KingdomUnited StatesUpper middle incomeUruguayUzbekistanVanuatuVenezuela, RBVietnamWest Bank and GazaWorldYemen, Rep.ZambiaZimbabwe Timeline:
This timeline shows a graph from 1971 to 2015 of East Asia & Pacific. No data until 1970. Number of actual observations by date: 45.
Source name:
World Development Indicators
Source organization:
UNESCO Institute for Statistics
Categories, topics:
Education
Last updated:
apr 23, 2017
Indicators value changes by year
Maximum:
39.148
jan 1, 2015
At the date of observation
Value
Absolute change
Change from previous value
jan 1, 1971
3.155
+3.155
0.0%
jan 1, 1972
3.047
-0.107
-3.4%
jan 1, 1973
3.156
+0.109
3.57%
jan 1, 1974
3.243
+0.088
2.78%
jan 1, 1975
3.514
+0.271
8.34%
jan 1, 1976
3.813
+0.299
8.52%
jan 1, 1977
4.097
+0.284
7.45%
jan 1, 1978
4.293
+0.196
4.78%
jan 1, 1979
4.654
+0.361
8.4%
jan 1, 1980
5.071
+0.418
8.97%
jan 1, 1981
5.373
+0.301
5.94%
jan 1, 1982
5.783
+0.41
7.63%
jan 1, 1983
6.226
+0.443
7.66%
jan 1, 1984
6.428
+0.202
3.24%
jan 1, 1985
6.742
+0.314
4.89%
jan 1, 1986
7.002
+0.261
3.87%
jan 1, 1987
7.183
+0.181
2.58%
jan 1, 1988
7.319
+0.136
1.89%
jan 1, 1989
7.219
-0.1
-1.36%
jan 1, 1990
7.328
+0.109
1.51%
jan 1, 1991
7.391
+0.062
0.85%
jan 1, 1992
7.548
+0.158
2.13%
jan 1, 1993
7.698
+0.15
1.99%
jan 1, 1994
8.431
+0.733
9.52%
jan 1, 1995
9.425
+0.993
11.78%
jan 1, 1996
10.351
+0.927
9.83%
jan 1, 1997
11.262
+0.911
8.8%
jan 1, 1998
12.385
+1.123
9.97%
jan 1, 1999
13.199
+0.814
6.57%
jan 1, 2000
14.349
+1.15
8.72%
jan 1, 2001
15.488
+1.139
7.94%
jan 1, 2002
17.066
+1.578
10.19%
jan 1, 2003
19.002
+1.936
11.35%
jan 1, 2004
20.823
+1.821
9.58%
jan 1, 2005
22.336
+1.514
7.27%
jan 1, 2006
23.319
+0.983
4.4%
jan 1, 2007
24.025
+0.706
3.03%
jan 1, 2008
24.466
+0.441
1.83%
jan 1, 2009
24.982
+0.516
2.11%
jan 1, 2010
26.392
+1.41
5.64%
jan 1, 2011
27.78
+1.388
5.26%
jan 1, 2012
29.031
+1.251
4.5%
jan 1, 2013
31.092
+2.062
7.1%
jan 1, 2014
33.308
+2.215
7.13%
jan 1, 2015
39.148
+5.84
17.53%
Ranking of countries by current statistics by years


Comments: