29
/
en
AIzaSyAYiBZKx7MnpbEhh9jyipgxe19OcubqV5w
April 1, 2024
57091
South Asia
SAS
false
2
1
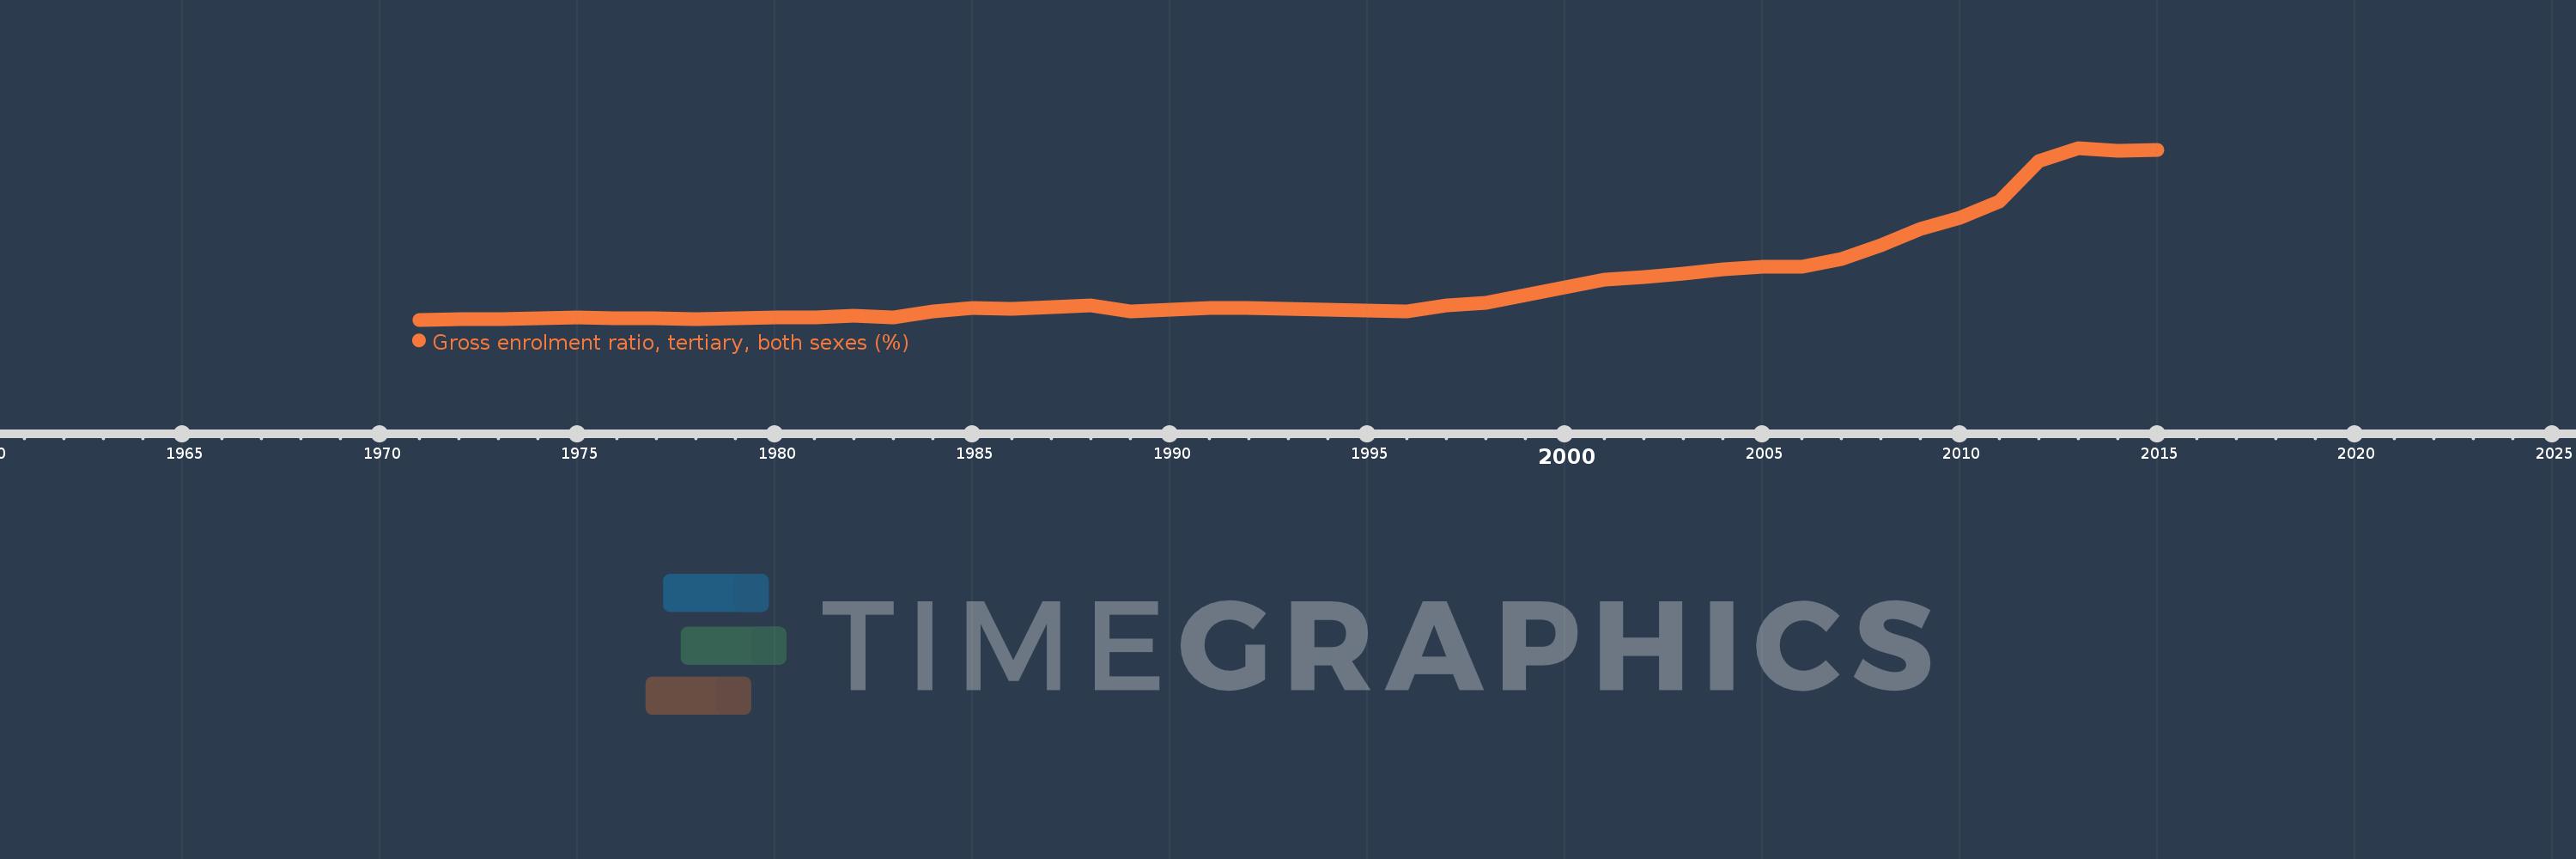
Gross enrolment ratio, tertiary, both sexes (%)
2015,2014,2013,2012,2011,2010,2009,2008,2007,2006,2005,2004,2003,2002,2001,2000,1999,1998,1997,1996,1995,1994,1993,1992,1991,1990,1989,1988,1987,1986,1985,1984,1983,1982,1981,1980,1979,1978,1977,1976,1975,1974,1973,1972,1971
This statistics in other country:
AfghanistanAlbaniaAlgeriaAngolaAntigua and BarbudaArab WorldArgentinaArmeniaArubaAustraliaAustriaAzerbaijanBahamas, TheBahrainBangladeshBarbadosBelarusBelgiumBelizeBeninBermudaBhutanBoliviaBosnia and HerzegovinaBotswanaBrazilBritish Virgin IslandsBrunei DarussalamBulgariaBurkina FasoBurundiCabo VerdeCambodiaCameroonCanadaCaribbean small statesCentral African RepublicCentral Europe and the BalticsChadChileChinaColombiaComorosCongo, Dem. Rep.Congo, Rep.Costa RicaCote d'IvoireCroatiaCubaCuracaoCyprusCzech RepublicDenmarkDjiboutiDominicaDominican RepublicEarly-demographic dividendEast Asia & PacificEast Asia & Pacific (excluding high income)East Asia & Pacific (IDA & IBRD countries)EcuadorEgypt, Arab Rep.El SalvadorEquatorial GuineaEritreaEstoniaEthiopiaEuro areaEurope & Central AsiaEurope & Central Asia (excluding high income)Europe & Central Asia (IDA & IBRD countries)European UnionFijiFinlandFragile and conflict affected situationsFranceGabonGambia, TheGeorgiaGermanyGhanaGreeceGrenadaGuatemalaGuineaGuinea-BissauGuyanaHaitiHeavily indebted poor countries (HIPC)High incomeHondurasHong Kong SAR, ChinaHungaryIBRD onlyIcelandIDA & IBRD totalIDA blendIDA onlyIDA totalIndiaIndonesiaIran, Islamic Rep.IraqIrelandIsraelItalyJamaicaJapanJordanKazakhstanKenyaKorea, Dem. People’s Rep.Korea, Rep.KuwaitKyrgyz RepublicLao PDRLate-demographic dividendLatin America & Caribbean Latin America & Caribbean (excluding high income)Latin America & the Caribbean (IDA & IBRD countries)LatviaLeast developed countries: UN classificationLebanonLesothoLiberiaLibyaLiechtensteinLithuaniaLow & middle incomeLow incomeLower middle incomeLuxembourgMacao SAR, ChinaMacedonia, FYRMadagascarMalawiMalaysiaMaldivesMaliMaltaMarshall IslandsMauritaniaMauritiusMexicoMicronesia, Fed. Sts.Middle East & North AfricaMiddle East & North Africa (excluding high income)Middle East & North Africa (IDA & IBRD countries)Middle incomeMoldovaMongoliaMontenegroMoroccoMozambiqueMyanmarNamibiaNepalNetherlandsNew ZealandNicaraguaNigerNigeriaNorth AmericaNorwayOECD membersOmanOther small statesPacific island small statesPakistanPalauPanamaPapua New GuineaParaguayPeruPhilippinesPolandPortugalPost-demographic dividendPre-demographic dividendPuerto RicoQatarRomaniaRussian FederationRwandaSamoaSan MarinoSao Tome and PrincipeSaudi ArabiaSenegalSerbiaSeychellesSierra LeoneSingaporeSlovak RepublicSloveniaSmall statesSomaliaSouth AfricaSouth AsiaSouth Asia (IDA & IBRD)SpainSri LankaSt. Kitts and NevisSt. LuciaSt. Vincent and the GrenadinesSub-Saharan Africa Sub-Saharan Africa (excluding high income)Sub-Saharan Africa (IDA & IBRD countries)SudanSurinameSwazilandSwedenSwitzerlandSyrian Arab RepublicTajikistanTanzaniaThailandTimor-LesteTogoTongaTrinidad and TobagoTunisiaTurkeyTurkmenistanUgandaUkraineUnited Arab EmiratesUnited KingdomUnited StatesUpper middle incomeUruguayUzbekistanVanuatuVenezuela, RBVietnamWest Bank and GazaWorldYemen, Rep.ZambiaZimbabwe Timeline:
This timeline shows a graph from 1971 to 2015 of South Asia. No data until 1970. Number of actual observations by date: 45.
Source name:
World Development Indicators
Source organization:
UNESCO Institute for Statistics
Categories, topics:
Education
Last updated:
apr 23, 2017
Indicators value changes by year
Maximum:
21.074
jan 1, 2013
At the date of observation
Value
Absolute change
Change from previous value
jan 1, 1971
4.277
+4.277
0.0%
jan 1, 1972
4.315
+0.038
0.89%
jan 1, 1973
4.361
+0.046
1.07%
jan 1, 1974
4.418
+0.057
1.31%
jan 1, 1975
4.483
+0.064
1.46%
jan 1, 1976
4.455
-0.027
-0.61%
jan 1, 1977
4.43
-0.026
-0.57%
jan 1, 1978
4.328
-0.102
-2.31%
jan 1, 1979
4.408
+0.08
1.85%
jan 1, 1980
4.49
+0.082
1.87%
jan 1, 1981
4.477
-0.013
-0.3%
jan 1, 1982
4.694
+0.217
4.84%
jan 1, 1983
4.544
-0.15
-3.2%
jan 1, 1984
5.108
+0.564
12.42%
jan 1, 1985
5.39
+0.282
5.53%
jan 1, 1986
5.371
-0.019
-0.35%
jan 1, 1987
5.513
+0.141
2.63%
jan 1, 1988
5.703
+0.191
3.46%
jan 1, 1989
5.08
-0.623
-10.93%
jan 1, 1990
5.234
+0.154
3.03%
jan 1, 1991
5.417
+0.183
3.49%
jan 1, 1992
5.464
+0.047
0.86%
jan 1, 1993
5.333
-0.131
-2.39%
jan 1, 1994
5.255
-0.078
-1.47%
jan 1, 1995
5.172
-0.083
-1.57%
jan 1, 1996
5.097
-0.075
-1.45%
jan 1, 1997
5.688
+0.591
11.6%
jan 1, 1998
5.92
+0.232
4.08%
jan 1, 1999
6.692
+0.772
13.04%
jan 1, 2000
7.461
+0.769
11.49%
jan 1, 2001
8.213
+0.752
10.07%
jan 1, 2002
8.466
+0.253
3.09%
jan 1, 2003
8.819
+0.353
4.17%
jan 1, 2004
9.168
+0.348
3.95%
jan 1, 2005
9.435
+0.268
2.92%
jan 1, 2006
9.492
+0.057
0.6%
jan 1, 2007
10.204
+0.712
7.5%
jan 1, 2008
11.595
+1.391
13.63%
jan 1, 2009
13.143
+1.547
13.35%
jan 1, 2010
14.224
+1.081
8.23%
jan 1, 2011
15.856
+1.632
11.48%
jan 1, 2012
19.748
+3.892
24.54%
jan 1, 2013
21.074
+1.326
6.72%
jan 1, 2014
20.827
-0.248
-1.18%
jan 1, 2015
20.839
+0.012
0.06%
Ranking of countries by current statistics by years


Comments: