29
/
en
AIzaSyAYiBZKx7MnpbEhh9jyipgxe19OcubqV5w
April 1, 2024
275747
United Kingdom
GBR
true
2
1
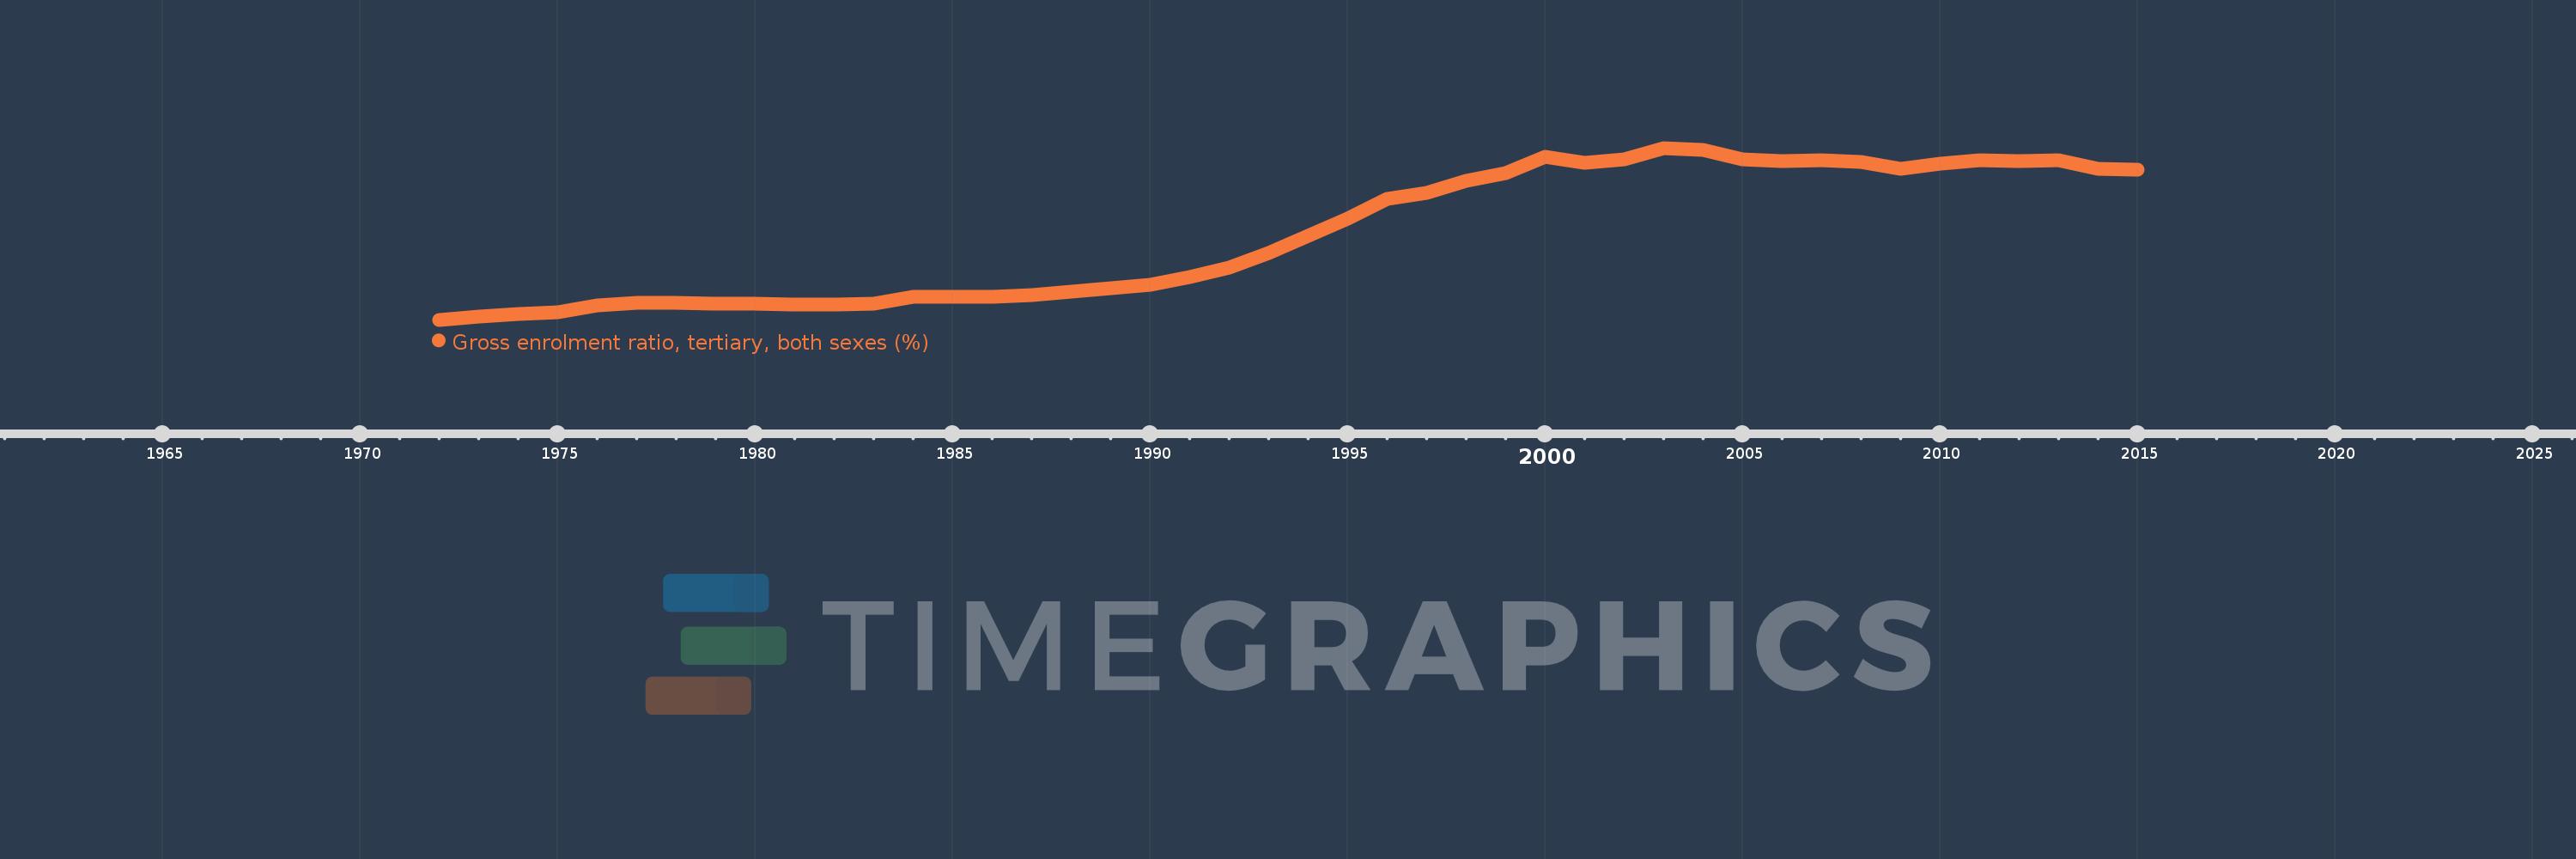
Gross enrolment ratio, tertiary, both sexes (%)
2015,2014,2013,2012,2011,2010,2009,2008,2007,2006,2005,2004,2003,2002,2001,2000,1999,1998,1997,1996,1995,1994,1993,1992,1991,1990,1989,1988,1987,1986,1985,1984,1983,1982,1981,1980,1979,1978,1977,1976,1975,1974,1973,1972
This statistics in other country:
AfghanistanAlbaniaAlgeriaAngolaAntigua and BarbudaArab WorldArgentinaArmeniaArubaAustraliaAustriaAzerbaijanBahamas, TheBahrainBangladeshBarbadosBelarusBelgiumBelizeBeninBermudaBhutanBoliviaBosnia and HerzegovinaBotswanaBrazilBritish Virgin IslandsBrunei DarussalamBulgariaBurkina FasoBurundiCabo VerdeCambodiaCameroonCanadaCaribbean small statesCentral African RepublicCentral Europe and the BalticsChadChileChinaColombiaComorosCongo, Dem. Rep.Congo, Rep.Costa RicaCote d'IvoireCroatiaCubaCuracaoCyprusCzech RepublicDenmarkDjiboutiDominicaDominican RepublicEarly-demographic dividendEast Asia & PacificEast Asia & Pacific (excluding high income)East Asia & Pacific (IDA & IBRD countries)EcuadorEgypt, Arab Rep.El SalvadorEquatorial GuineaEritreaEstoniaEthiopiaEuro areaEurope & Central AsiaEurope & Central Asia (excluding high income)Europe & Central Asia (IDA & IBRD countries)European UnionFijiFinlandFragile and conflict affected situationsFranceGabonGambia, TheGeorgiaGermanyGhanaGreeceGrenadaGuatemalaGuineaGuinea-BissauGuyanaHaitiHeavily indebted poor countries (HIPC)High incomeHondurasHong Kong SAR, ChinaHungaryIBRD onlyIcelandIDA & IBRD totalIDA blendIDA onlyIDA totalIndiaIndonesiaIran, Islamic Rep.IraqIrelandIsraelItalyJamaicaJapanJordanKazakhstanKenyaKorea, Dem. People’s Rep.Korea, Rep.KuwaitKyrgyz RepublicLao PDRLate-demographic dividendLatin America & Caribbean Latin America & Caribbean (excluding high income)Latin America & the Caribbean (IDA & IBRD countries)LatviaLeast developed countries: UN classificationLebanonLesothoLiberiaLibyaLiechtensteinLithuaniaLow & middle incomeLow incomeLower middle incomeLuxembourgMacao SAR, ChinaMacedonia, FYRMadagascarMalawiMalaysiaMaldivesMaliMaltaMarshall IslandsMauritaniaMauritiusMexicoMicronesia, Fed. Sts.Middle East & North AfricaMiddle East & North Africa (excluding high income)Middle East & North Africa (IDA & IBRD countries)Middle incomeMoldovaMongoliaMontenegroMoroccoMozambiqueMyanmarNamibiaNepalNetherlandsNew ZealandNicaraguaNigerNigeriaNorth AmericaNorwayOECD membersOmanOther small statesPacific island small statesPakistanPalauPanamaPapua New GuineaParaguayPeruPhilippinesPolandPortugalPost-demographic dividendPre-demographic dividendPuerto RicoQatarRomaniaRussian FederationRwandaSamoaSan MarinoSao Tome and PrincipeSaudi ArabiaSenegalSerbiaSeychellesSierra LeoneSingaporeSlovak RepublicSloveniaSmall statesSomaliaSouth AfricaSouth AsiaSouth Asia (IDA & IBRD)SpainSri LankaSt. Kitts and NevisSt. LuciaSt. Vincent and the GrenadinesSub-Saharan Africa Sub-Saharan Africa (excluding high income)Sub-Saharan Africa (IDA & IBRD countries)SudanSurinameSwazilandSwedenSwitzerlandSyrian Arab RepublicTajikistanTanzaniaThailandTimor-LesteTogoTongaTrinidad and TobagoTunisiaTurkeyTurkmenistanUgandaUkraineUnited Arab EmiratesUnited KingdomUnited StatesUpper middle incomeUruguayUzbekistanVanuatuVenezuela, RBVietnamWest Bank and GazaWorldYemen, Rep.ZambiaZimbabwe Timeline:
This timeline shows a graph from 1972 to 2015 of United Kingdom. No data until 1971. Number of actual observations by date: 44.
Source name:
World Development Indicators
Source organization:
UNESCO Institute for Statistics
Categories, topics:
Education
Last updated:
apr 23, 2017
Indicators value changes by year
Minimum:
14.568
jan 1, 1972
Maximum:
62.602
jan 1, 2003
At the date of observation
Value
Absolute change
Change from previous value
jan 1, 1972
14.568
+14.568
0.0%
jan 1, 1973
15.444
+0.876
6.01%
jan 1, 1974
16.088
+0.645
4.18%
jan 1, 1975
16.752
+0.664
4.13%
jan 1, 1976
18.582
+1.829
10.92%
jan 1, 1977
19.209
+0.627
3.38%
jan 1, 1978
19.338
+0.129
0.67%
jan 1, 1979
19.126
-0.213
-1.1%
jan 1, 1980
19.156
+0.03
0.16%
jan 1, 1981
18.838
-0.317
-1.66%
jan 1, 1982
18.876
+0.037
0.2%
jan 1, 1983
18.955
+0.079
0.42%
jan 1, 1984
21.056
+2.1
11.08%
jan 1, 1985
21.072
+0.016
0.08%
jan 1, 1986
20.998
-0.074
-0.35%
jan 1, 1987
21.517
+0.519
2.47%
jan 1, 1988
22.539
+1.022
4.75%
jan 1, 1989
23.307
+0.768
3.41%
jan 1, 1990
24.393
+1.086
4.66%
jan 1, 1991
26.474
+2.081
8.53%
jan 1, 1992
29.173
+2.699
10.19%
jan 1, 1993
33.221
+4.048
13.88%
jan 1, 1994
37.976
+4.755
14.31%
jan 1, 1995
42.806
+4.83
12.72%
jan 1, 1996
48.25
+5.444
12.72%
jan 1, 1997
50.082
+1.831
3.8%
jan 1, 1998
53.298
+3.216
6.42%
jan 1, 1999
55.571
+2.274
4.27%
jan 1, 2000
60.158
+4.587
8.25%
jan 1, 2001
58.524
-1.634
-2.72%
jan 1, 2002
59.309
+0.784
1.34%
jan 1, 2003
62.602
+3.293
5.55%
jan 1, 2004
62.086
-0.515
-0.82%
jan 1, 2005
59.363
-2.723
-4.39%
jan 1, 2006
59.001
-0.362
-0.61%
jan 1, 2007
59.127
+0.126
0.21%
jan 1, 2008
58.652
-0.475
-0.8%
jan 1, 2009
56.874
-1.778
-3.03%
jan 1, 2010
58.153
+1.279
2.25%
jan 1, 2011
59.067
+0.914
1.57%
jan 1, 2012
58.986
-0.081
-0.14%
jan 1, 2013
59.223
+0.237
0.4%
jan 1, 2014
56.87
-2.353
-3.97%
jan 1, 2015
56.477
-0.393
-0.69%
Ranking of countries by current statistics by years


Comments: