29
/
en
AIzaSyAYiBZKx7MnpbEhh9jyipgxe19OcubqV5w
April 1, 2024
264659
Togo
TGO
true
2
1
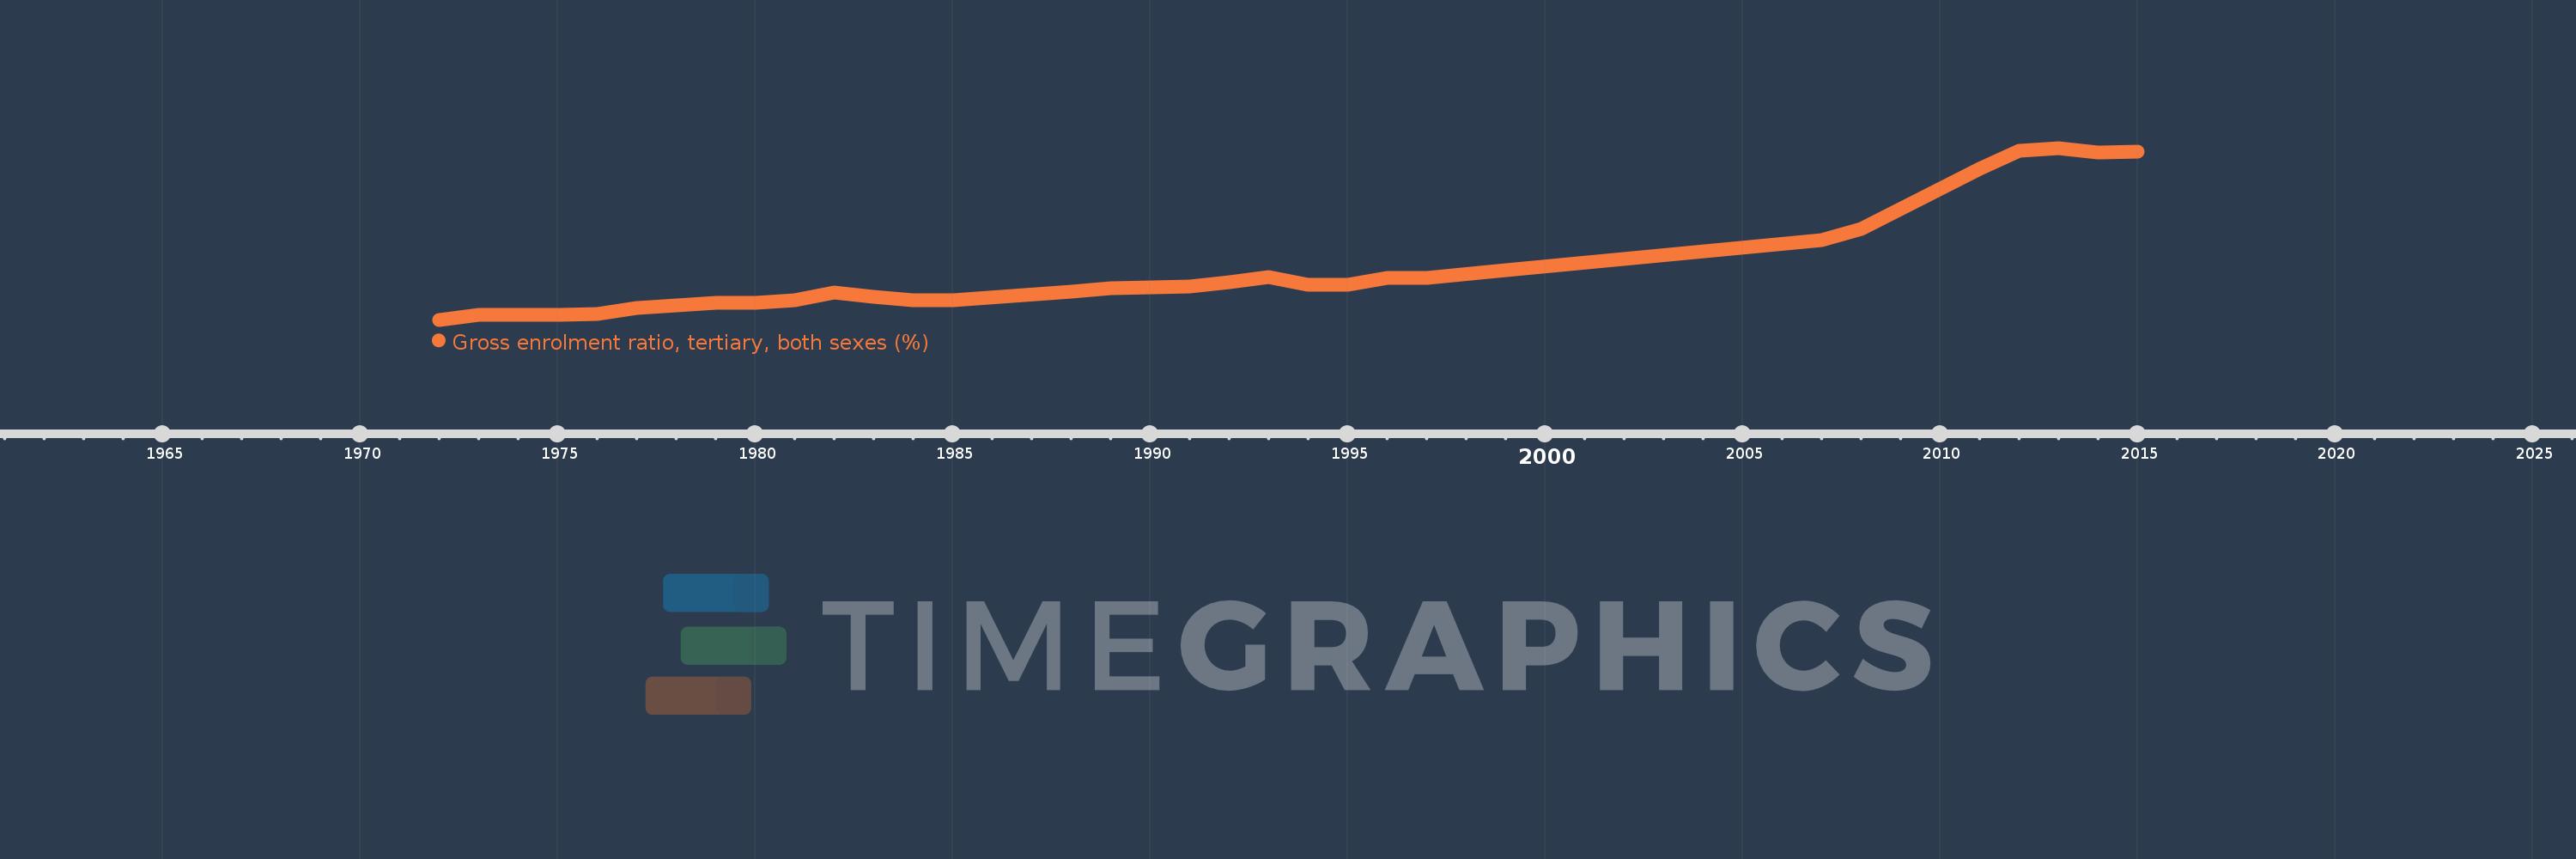
Gross enrolment ratio, tertiary, both sexes (%)
2015,2014,2013,2012,2011,2008,2007,1999,1997,1996,1995,1994,1993,1992,1991,1990,1989,1988,1985,1984,1983,1982,1981,1980,1979,1978,1977,1976,1975,1974,1973,1972
This statistics in other country:
AfghanistanAlbaniaAlgeriaAngolaAntigua and BarbudaArab WorldArgentinaArmeniaArubaAustraliaAustriaAzerbaijanBahamas, TheBahrainBangladeshBarbadosBelarusBelgiumBelizeBeninBermudaBhutanBoliviaBosnia and HerzegovinaBotswanaBrazilBritish Virgin IslandsBrunei DarussalamBulgariaBurkina FasoBurundiCabo VerdeCambodiaCameroonCanadaCaribbean small statesCentral African RepublicCentral Europe and the BalticsChadChileChinaColombiaComorosCongo, Dem. Rep.Congo, Rep.Costa RicaCote d'IvoireCroatiaCubaCuracaoCyprusCzech RepublicDenmarkDjiboutiDominicaDominican RepublicEarly-demographic dividendEast Asia & PacificEast Asia & Pacific (excluding high income)East Asia & Pacific (IDA & IBRD countries)EcuadorEgypt, Arab Rep.El SalvadorEquatorial GuineaEritreaEstoniaEthiopiaEuro areaEurope & Central AsiaEurope & Central Asia (excluding high income)Europe & Central Asia (IDA & IBRD countries)European UnionFijiFinlandFragile and conflict affected situationsFranceGabonGambia, TheGeorgiaGermanyGhanaGreeceGrenadaGuatemalaGuineaGuinea-BissauGuyanaHaitiHeavily indebted poor countries (HIPC)High incomeHondurasHong Kong SAR, ChinaHungaryIBRD onlyIcelandIDA & IBRD totalIDA blendIDA onlyIDA totalIndiaIndonesiaIran, Islamic Rep.IraqIrelandIsraelItalyJamaicaJapanJordanKazakhstanKenyaKorea, Dem. People’s Rep.Korea, Rep.KuwaitKyrgyz RepublicLao PDRLate-demographic dividendLatin America & Caribbean Latin America & Caribbean (excluding high income)Latin America & the Caribbean (IDA & IBRD countries)LatviaLeast developed countries: UN classificationLebanonLesothoLiberiaLibyaLiechtensteinLithuaniaLow & middle incomeLow incomeLower middle incomeLuxembourgMacao SAR, ChinaMacedonia, FYRMadagascarMalawiMalaysiaMaldivesMaliMaltaMarshall IslandsMauritaniaMauritiusMexicoMicronesia, Fed. Sts.Middle East & North AfricaMiddle East & North Africa (excluding high income)Middle East & North Africa (IDA & IBRD countries)Middle incomeMoldovaMongoliaMontenegroMoroccoMozambiqueMyanmarNamibiaNepalNetherlandsNew ZealandNicaraguaNigerNigeriaNorth AmericaNorwayOECD membersOmanOther small statesPacific island small statesPakistanPalauPanamaPapua New GuineaParaguayPeruPhilippinesPolandPortugalPost-demographic dividendPre-demographic dividendPuerto RicoQatarRomaniaRussian FederationRwandaSamoaSan MarinoSao Tome and PrincipeSaudi ArabiaSenegalSerbiaSeychellesSierra LeoneSingaporeSlovak RepublicSloveniaSmall statesSomaliaSouth AfricaSouth AsiaSouth Asia (IDA & IBRD)SpainSri LankaSt. Kitts and NevisSt. LuciaSt. Vincent and the GrenadinesSub-Saharan Africa Sub-Saharan Africa (excluding high income)Sub-Saharan Africa (IDA & IBRD countries)SudanSurinameSwazilandSwedenSwitzerlandSyrian Arab RepublicTajikistanTanzaniaThailandTimor-LesteTogoTongaTrinidad and TobagoTunisiaTurkeyTurkmenistanUgandaUkraineUnited Arab EmiratesUnited KingdomUnited StatesUpper middle incomeUruguayUzbekistanVanuatuVenezuela, RBVietnamWest Bank and GazaWorldYemen, Rep.ZambiaZimbabwe Timeline:
This timeline shows a graph from 1972 to 2015 of Togo. No data until 1971. Number of actual observations by date: 32.
Source name:
World Development Indicators
Source organization:
UNESCO Institute for Statistics
Categories, topics:
Education
Last updated:
apr 23, 2017
Indicators value changes by year
Maximum:
10.321
jan 1, 2013
At the date of observation
Value
Absolute change
Change from previous value
jan 1, 1972
0.479
+0.479
0.0%
jan 1, 1973
0.742
+0.263
55.01%
jan 1, 1974
0.754
+0.012
1.59%
jan 1, 1975
0.739
-0.015
-2.01%
jan 1, 1976
0.796
+0.057
7.72%
jan 1, 1977
1.131
+0.335
42.05%
jan 1, 1978
1.31
+0.179
15.81%
jan 1, 1979
1.456
+0.147
11.19%
jan 1, 1980
1.429
-0.028
-1.9%
jan 1, 1981
1.599
+0.171
11.95%
jan 1, 1982
2.023
+0.424
26.5%
jan 1, 1983
1.772
-0.251
-12.42%
jan 1, 1984
1.595
-0.176
-9.94%
jan 1, 1985
1.607
+0.011
0.7%
jan 1, 1988
2.099
+0.492
30.65%
jan 1, 1989
2.308
+0.209
9.95%
jan 1, 1990
2.343
+0.036
1.54%
jan 1, 1991
2.373
+0.03
1.27%
jan 1, 1992
2.623
+0.25
10.51%
jan 1, 1993
2.904
+0.281
10.73%
jan 1, 1994
2.459
-0.445
-15.31%
jan 1, 1995
2.488
+0.028
1.16%
jan 1, 1996
2.884
+0.396
15.91%
jan 1, 1997
2.897
+0.014
0.48%
jan 1, 1999
3.312
+0.414
14.29%
jan 1, 2007
5.019
+1.708
51.56%
jan 1, 2008
5.668
+0.649
12.93%
jan 1, 2011
9.128
+3.459
61.03%
jan 1, 2012
10.158
+1.03
11.29%
jan 1, 2013
10.321
+0.163
1.61%
jan 1, 2014
10.042
-0.279
-2.71%
jan 1, 2015
10.118
+0.075
0.75%
Ranking of countries by current statistics by years


Comments: