29
/
en
AIzaSyAYiBZKx7MnpbEhh9jyipgxe19OcubqV5w
April 1, 2024
107305
Colombia
COL
true
2
1
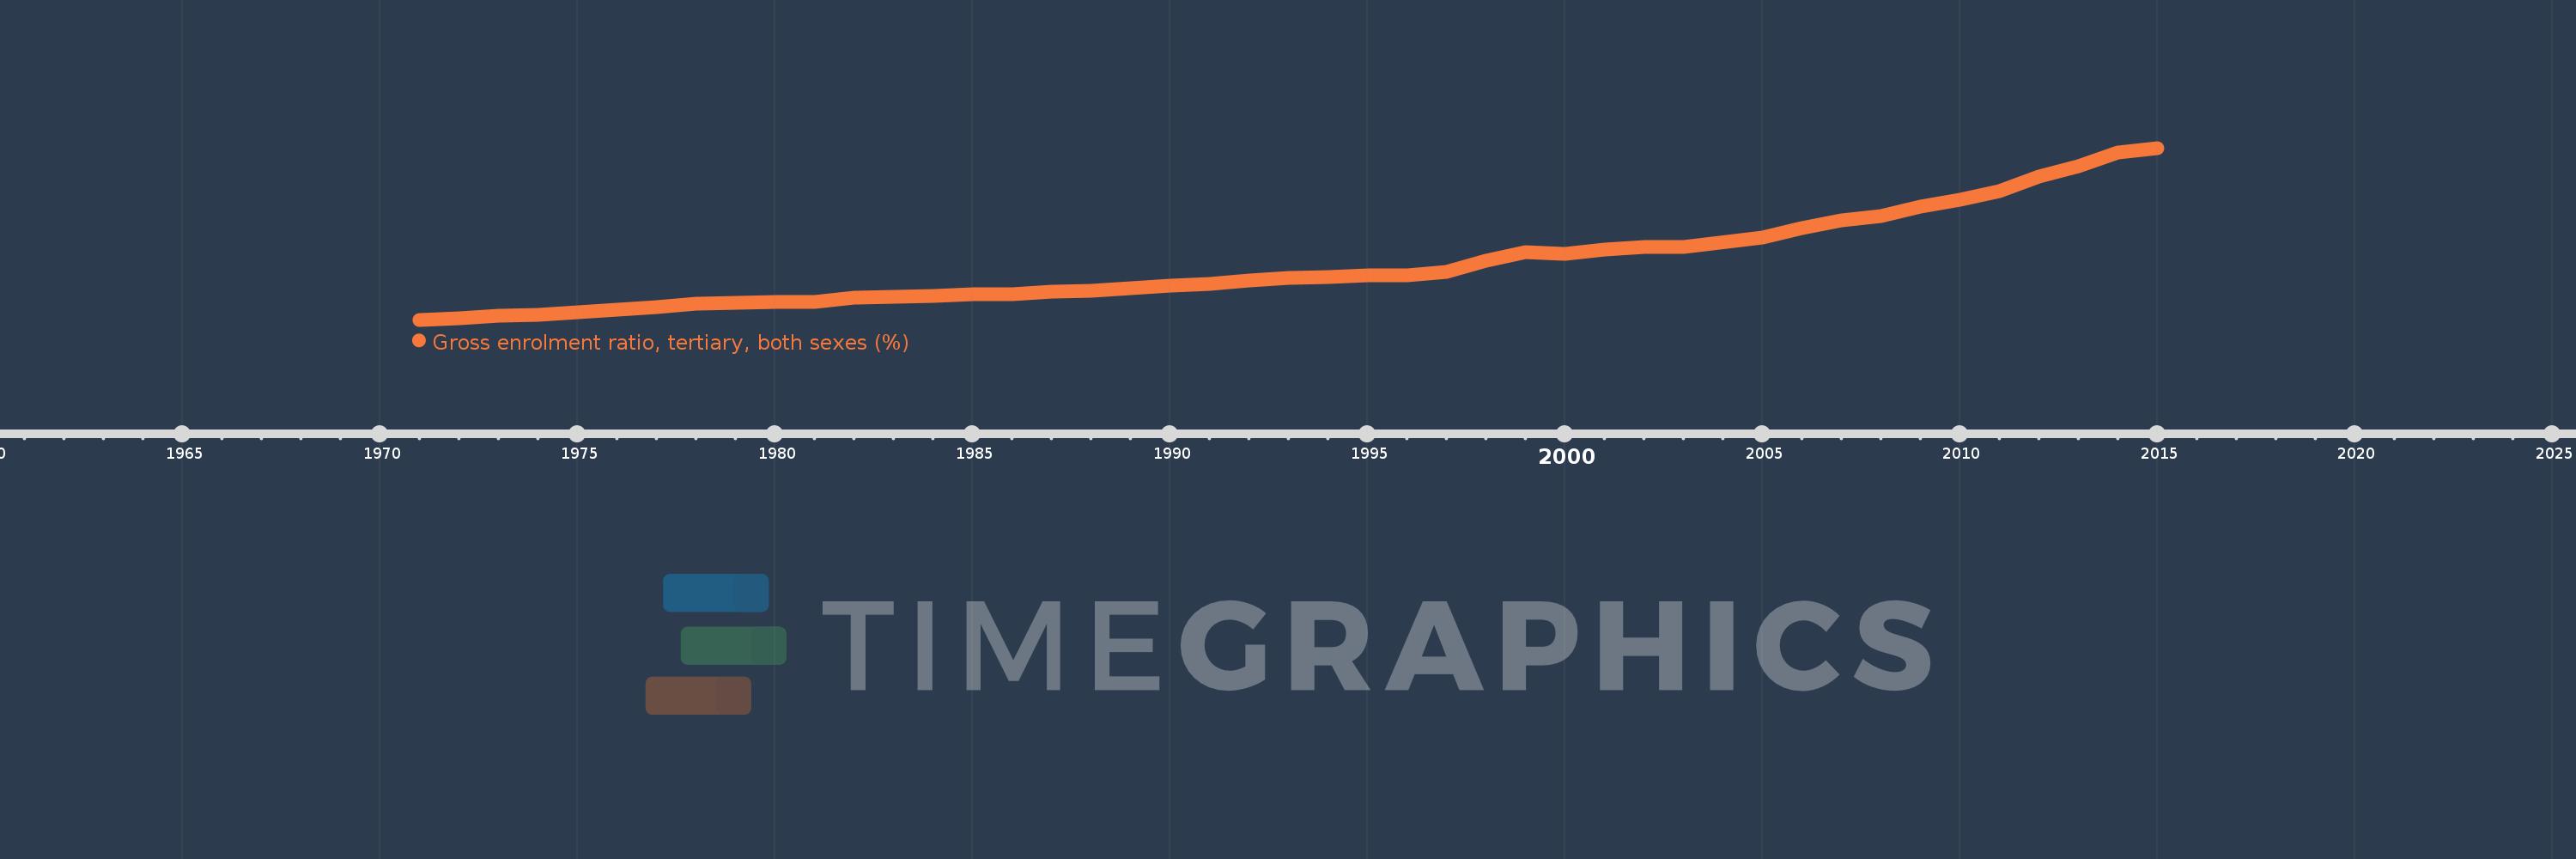
Gross enrolment ratio, tertiary, both sexes (%)
2015,2014,2013,2012,2011,2010,2009,2008,2007,2006,2005,2003,2002,2001,2000,1999,1998,1997,1996,1995,1994,1993,1992,1991,1990,1989,1988,1987,1986,1985,1984,1983,1982,1981,1980,1979,1978,1977,1976,1975,1974,1973,1972,1971
This statistics in other country:
AfghanistanAlbaniaAlgeriaAngolaAntigua and BarbudaArab WorldArgentinaArmeniaArubaAustraliaAustriaAzerbaijanBahamas, TheBahrainBangladeshBarbadosBelarusBelgiumBelizeBeninBermudaBhutanBoliviaBosnia and HerzegovinaBotswanaBrazilBritish Virgin IslandsBrunei DarussalamBulgariaBurkina FasoBurundiCabo VerdeCambodiaCameroonCanadaCaribbean small statesCentral African RepublicCentral Europe and the BalticsChadChileChinaColombiaComorosCongo, Dem. Rep.Congo, Rep.Costa RicaCote d'IvoireCroatiaCubaCuracaoCyprusCzech RepublicDenmarkDjiboutiDominicaDominican RepublicEarly-demographic dividendEast Asia & PacificEast Asia & Pacific (excluding high income)East Asia & Pacific (IDA & IBRD countries)EcuadorEgypt, Arab Rep.El SalvadorEquatorial GuineaEritreaEstoniaEthiopiaEuro areaEurope & Central AsiaEurope & Central Asia (excluding high income)Europe & Central Asia (IDA & IBRD countries)European UnionFijiFinlandFragile and conflict affected situationsFranceGabonGambia, TheGeorgiaGermanyGhanaGreeceGrenadaGuatemalaGuineaGuinea-BissauGuyanaHaitiHeavily indebted poor countries (HIPC)High incomeHondurasHong Kong SAR, ChinaHungaryIBRD onlyIcelandIDA & IBRD totalIDA blendIDA onlyIDA totalIndiaIndonesiaIran, Islamic Rep.IraqIrelandIsraelItalyJamaicaJapanJordanKazakhstanKenyaKorea, Dem. People’s Rep.Korea, Rep.KuwaitKyrgyz RepublicLao PDRLate-demographic dividendLatin America & Caribbean Latin America & Caribbean (excluding high income)Latin America & the Caribbean (IDA & IBRD countries)LatviaLeast developed countries: UN classificationLebanonLesothoLiberiaLibyaLiechtensteinLithuaniaLow & middle incomeLow incomeLower middle incomeLuxembourgMacao SAR, ChinaMacedonia, FYRMadagascarMalawiMalaysiaMaldivesMaliMaltaMarshall IslandsMauritaniaMauritiusMexicoMicronesia, Fed. Sts.Middle East & North AfricaMiddle East & North Africa (excluding high income)Middle East & North Africa (IDA & IBRD countries)Middle incomeMoldovaMongoliaMontenegroMoroccoMozambiqueMyanmarNamibiaNepalNetherlandsNew ZealandNicaraguaNigerNigeriaNorth AmericaNorwayOECD membersOmanOther small statesPacific island small statesPakistanPalauPanamaPapua New GuineaParaguayPeruPhilippinesPolandPortugalPost-demographic dividendPre-demographic dividendPuerto RicoQatarRomaniaRussian FederationRwandaSamoaSan MarinoSao Tome and PrincipeSaudi ArabiaSenegalSerbiaSeychellesSierra LeoneSingaporeSlovak RepublicSloveniaSmall statesSomaliaSouth AfricaSouth AsiaSouth Asia (IDA & IBRD)SpainSri LankaSt. Kitts and NevisSt. LuciaSt. Vincent and the GrenadinesSub-Saharan Africa Sub-Saharan Africa (excluding high income)Sub-Saharan Africa (IDA & IBRD countries)SudanSurinameSwazilandSwedenSwitzerlandSyrian Arab RepublicTajikistanTanzaniaThailandTimor-LesteTogoTongaTrinidad and TobagoTunisiaTurkeyTurkmenistanUgandaUkraineUnited Arab EmiratesUnited KingdomUnited StatesUpper middle incomeUruguayUzbekistanVanuatuVenezuela, RBVietnamWest Bank and GazaWorldYemen, Rep.ZambiaZimbabwe Timeline:
This timeline shows a graph from 1971 to 2015 of Colombia. No data until 1970. Number of actual observations by date: 44.
Source name:
World Development Indicators
Source organization:
UNESCO Institute for Statistics
Categories, topics:
Education
Last updated:
apr 23, 2017
Indicators value changes by year
Maximum:
51.291
jan 1, 2015
At the date of observation
Value
Absolute change
Change from previous value
jan 1, 1971
3.985
+3.985
0.0%
jan 1, 1972
4.431
+0.447
11.21%
jan 1, 1973
5.005
+0.573
12.94%
jan 1, 1974
5.399
+0.394
7.88%
jan 1, 1975
5.937
+0.538
9.96%
jan 1, 1976
6.83
+0.894
15.05%
jan 1, 1977
7.382
+0.552
8.08%
jan 1, 1978
8.413
+1.031
13.97%
jan 1, 1979
8.722
+0.309
3.67%
jan 1, 1980
8.931
+0.209
2.4%
jan 1, 1981
8.764
-0.168
-1.88%
jan 1, 1982
9.988
+1.224
13.97%
jan 1, 1983
10.25
+0.262
2.62%
jan 1, 1984
10.573
+0.324
3.16%
jan 1, 1985
10.952
+0.378
3.58%
jan 1, 1986
11.073
+0.121
1.1%
jan 1, 1987
11.643
+0.57
5.15%
jan 1, 1988
12.044
+0.402
3.45%
jan 1, 1989
12.714
+0.67
5.56%
jan 1, 1990
13.326
+0.612
4.81%
jan 1, 1991
13.877
+0.551
4.13%
jan 1, 1992
14.693
+0.816
5.88%
jan 1, 1993
15.424
+0.731
4.97%
jan 1, 1994
15.655
+0.231
1.5%
jan 1, 1995
16.205
+0.55
3.51%
jan 1, 1996
16.147
-0.058
-0.36%
jan 1, 1997
17.277
+1.13
7.0%
jan 1, 1998
20.277
+3.0
17.37%
jan 1, 1999
22.642
+2.364
11.66%
jan 1, 2000
22.171
-0.47
-2.08%
jan 1, 2001
23.194
+1.023
4.62%
jan 1, 2002
23.92
+0.726
3.13%
jan 1, 2003
23.966
+0.045
0.19%
jan 1, 2005
26.614
+2.649
11.05%
jan 1, 2006
29.185
+2.571
9.66%
jan 1, 2007
31.332
+2.147
7.35%
jan 1, 2008
32.632
+1.301
4.15%
jan 1, 2009
35.246
+2.613
8.01%
jan 1, 2010
37.079
+1.833
5.2%
jan 1, 2011
39.409
+2.33
6.29%
jan 1, 2012
43.503
+4.094
10.39%
jan 1, 2013
46.216
+2.713
6.24%
jan 1, 2014
50.104
+3.888
8.41%
jan 1, 2015
51.291
+1.187
2.37%
Ranking of countries by current statistics by years


Comments: