29
/
en
AIzaSyAYiBZKx7MnpbEhh9jyipgxe19OcubqV5w
April 1, 2024
118967
Denmark
DNK
true
2
1
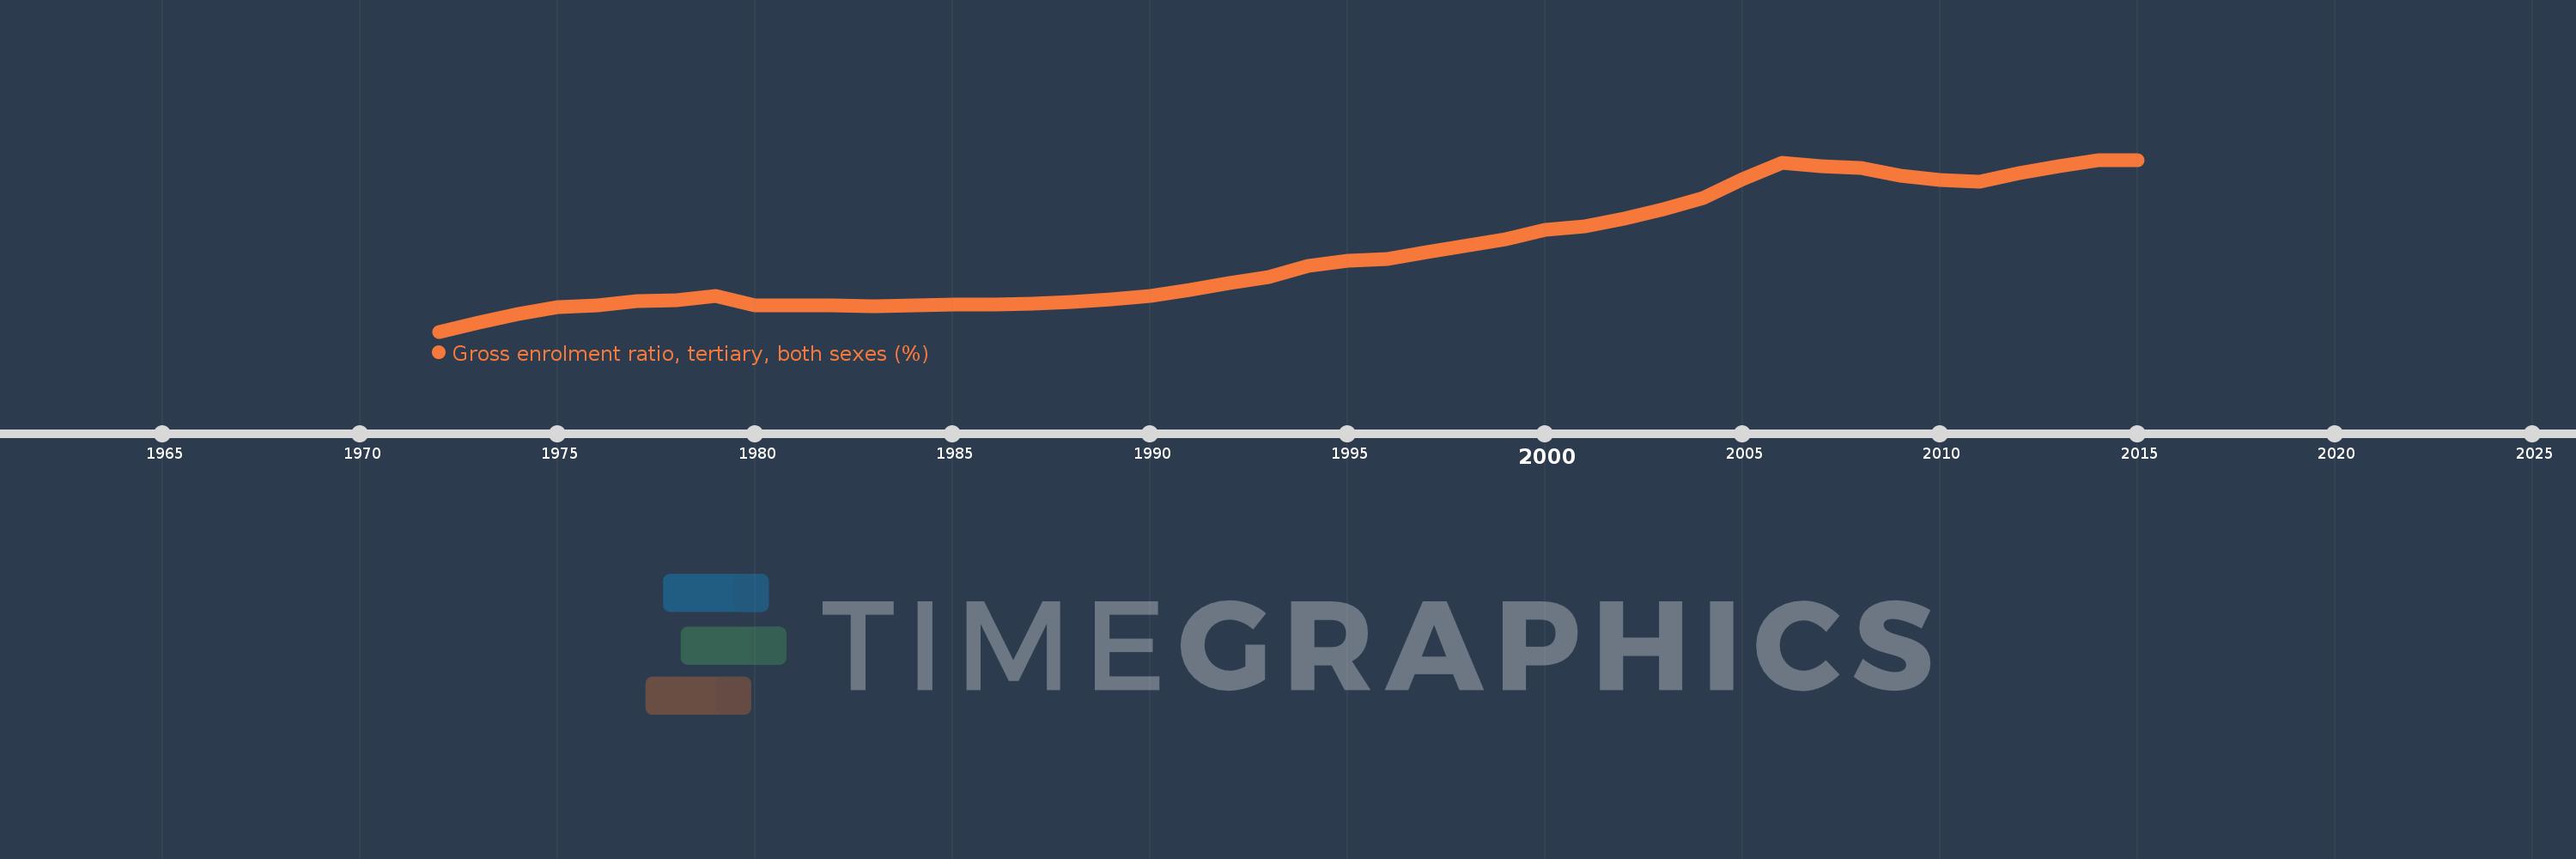
Gross enrolment ratio, tertiary, both sexes (%)
2015,2014,2013,2012,2011,2010,2009,2008,2007,2006,2005,2004,2003,2002,2001,2000,1999,1997,1996,1995,1994,1993,1992,1991,1990,1989,1988,1987,1986,1985,1984,1983,1982,1981,1980,1979,1978,1977,1976,1975,1974,1973,1972
This statistics in other country:
AfghanistanAlbaniaAlgeriaAngolaAntigua and BarbudaArab WorldArgentinaArmeniaArubaAustraliaAustriaAzerbaijanBahamas, TheBahrainBangladeshBarbadosBelarusBelgiumBelizeBeninBermudaBhutanBoliviaBosnia and HerzegovinaBotswanaBrazilBritish Virgin IslandsBrunei DarussalamBulgariaBurkina FasoBurundiCabo VerdeCambodiaCameroonCanadaCaribbean small statesCentral African RepublicCentral Europe and the BalticsChadChileChinaColombiaComorosCongo, Dem. Rep.Congo, Rep.Costa RicaCote d'IvoireCroatiaCubaCuracaoCyprusCzech RepublicDenmarkDjiboutiDominicaDominican RepublicEarly-demographic dividendEast Asia & PacificEast Asia & Pacific (excluding high income)East Asia & Pacific (IDA & IBRD countries)EcuadorEgypt, Arab Rep.El SalvadorEquatorial GuineaEritreaEstoniaEthiopiaEuro areaEurope & Central AsiaEurope & Central Asia (excluding high income)Europe & Central Asia (IDA & IBRD countries)European UnionFijiFinlandFragile and conflict affected situationsFranceGabonGambia, TheGeorgiaGermanyGhanaGreeceGrenadaGuatemalaGuineaGuinea-BissauGuyanaHaitiHeavily indebted poor countries (HIPC)High incomeHondurasHong Kong SAR, ChinaHungaryIBRD onlyIcelandIDA & IBRD totalIDA blendIDA onlyIDA totalIndiaIndonesiaIran, Islamic Rep.IraqIrelandIsraelItalyJamaicaJapanJordanKazakhstanKenyaKorea, Dem. People’s Rep.Korea, Rep.KuwaitKyrgyz RepublicLao PDRLate-demographic dividendLatin America & Caribbean Latin America & Caribbean (excluding high income)Latin America & the Caribbean (IDA & IBRD countries)LatviaLeast developed countries: UN classificationLebanonLesothoLiberiaLibyaLiechtensteinLithuaniaLow & middle incomeLow incomeLower middle incomeLuxembourgMacao SAR, ChinaMacedonia, FYRMadagascarMalawiMalaysiaMaldivesMaliMaltaMarshall IslandsMauritaniaMauritiusMexicoMicronesia, Fed. Sts.Middle East & North AfricaMiddle East & North Africa (excluding high income)Middle East & North Africa (IDA & IBRD countries)Middle incomeMoldovaMongoliaMontenegroMoroccoMozambiqueMyanmarNamibiaNepalNetherlandsNew ZealandNicaraguaNigerNigeriaNorth AmericaNorwayOECD membersOmanOther small statesPacific island small statesPakistanPalauPanamaPapua New GuineaParaguayPeruPhilippinesPolandPortugalPost-demographic dividendPre-demographic dividendPuerto RicoQatarRomaniaRussian FederationRwandaSamoaSan MarinoSao Tome and PrincipeSaudi ArabiaSenegalSerbiaSeychellesSierra LeoneSingaporeSlovak RepublicSloveniaSmall statesSomaliaSouth AfricaSouth AsiaSouth Asia (IDA & IBRD)SpainSri LankaSt. Kitts and NevisSt. LuciaSt. Vincent and the GrenadinesSub-Saharan Africa Sub-Saharan Africa (excluding high income)Sub-Saharan Africa (IDA & IBRD countries)SudanSurinameSwazilandSwedenSwitzerlandSyrian Arab RepublicTajikistanTanzaniaThailandTimor-LesteTogoTongaTrinidad and TobagoTunisiaTurkeyTurkmenistanUgandaUkraineUnited Arab EmiratesUnited KingdomUnited StatesUpper middle incomeUruguayUzbekistanVanuatuVenezuela, RBVietnamWest Bank and GazaWorldYemen, Rep.ZambiaZimbabwe Timeline:
This timeline shows a graph from 1972 to 2015 of Denmark. No data until 1971. Number of actual observations by date: 43.
Source name:
World Development Indicators
Source organization:
UNESCO Institute for Statistics
Categories, topics:
Education
Last updated:
apr 23, 2017
Indicators value changes by year
Minimum:
18.858
jan 1, 1972
Maximum:
81.516
jan 1, 2015
At the date of observation
Value
Absolute change
Change from previous value
jan 1, 1972
18.858
+18.858
0.0%
jan 1, 1973
22.069
+3.21
17.02%
jan 1, 1974
25.374
+3.305
14.98%
jan 1, 1975
27.666
+2.292
9.03%
jan 1, 1976
28.545
+0.879
3.18%
jan 1, 1977
30.061
+1.515
5.31%
jan 1, 1978
30.176
+0.115
0.38%
jan 1, 1979
31.943
+1.767
5.86%
jan 1, 1980
28.275
-3.668
-11.48%
jan 1, 1981
28.381
+0.106
0.38%
jan 1, 1982
28.272
-0.109
-0.38%
jan 1, 1983
27.966
-0.307
-1.08%
jan 1, 1984
28.561
+0.596
2.13%
jan 1, 1985
28.772
+0.211
0.74%
jan 1, 1986
28.836
+0.064
0.22%
jan 1, 1987
29.112
+0.276
0.96%
jan 1, 1988
29.632
+0.52
1.79%
jan 1, 1989
30.613
+0.981
3.31%
jan 1, 1990
31.879
+1.266
4.14%
jan 1, 1991
34.122
+2.243
7.04%
jan 1, 1992
36.488
+2.366
6.93%
jan 1, 1993
38.662
+2.174
5.96%
jan 1, 1994
42.748
+4.086
10.57%
jan 1, 1995
44.685
+1.937
4.53%
jan 1, 1996
45.476
+0.791
1.77%
jan 1, 1997
47.831
+2.354
5.18%
jan 1, 1999
52.483
+4.652
9.73%
jan 1, 2000
55.849
+3.366
6.41%
jan 1, 2001
57.249
+1.4
2.51%
jan 1, 2002
60.028
+2.779
4.85%
jan 1, 2003
63.534
+3.506
5.84%
jan 1, 2004
67.535
+4.0
6.3%
jan 1, 2005
74.437
+6.902
10.22%
jan 1, 2006
80.423
+5.987
8.04%
jan 1, 2007
79.065
-1.359
-1.69%
jan 1, 2008
78.585
-0.48
-0.61%
jan 1, 2009
75.703
-2.881
-3.67%
jan 1, 2010
74.301
-1.402
-1.85%
jan 1, 2011
73.62
-0.681
-0.92%
jan 1, 2012
76.801
+3.181
4.32%
jan 1, 2013
79.253
+2.451
3.19%
jan 1, 2014
81.237
+1.984
2.5%
jan 1, 2015
81.516
+0.279
0.34%
Ranking of countries by current statistics by years


Comments: