29
/
en
AIzaSyAYiBZKx7MnpbEhh9jyipgxe19OcubqV5w
April 1, 2024
214367
Norway
NOR
true
2
1
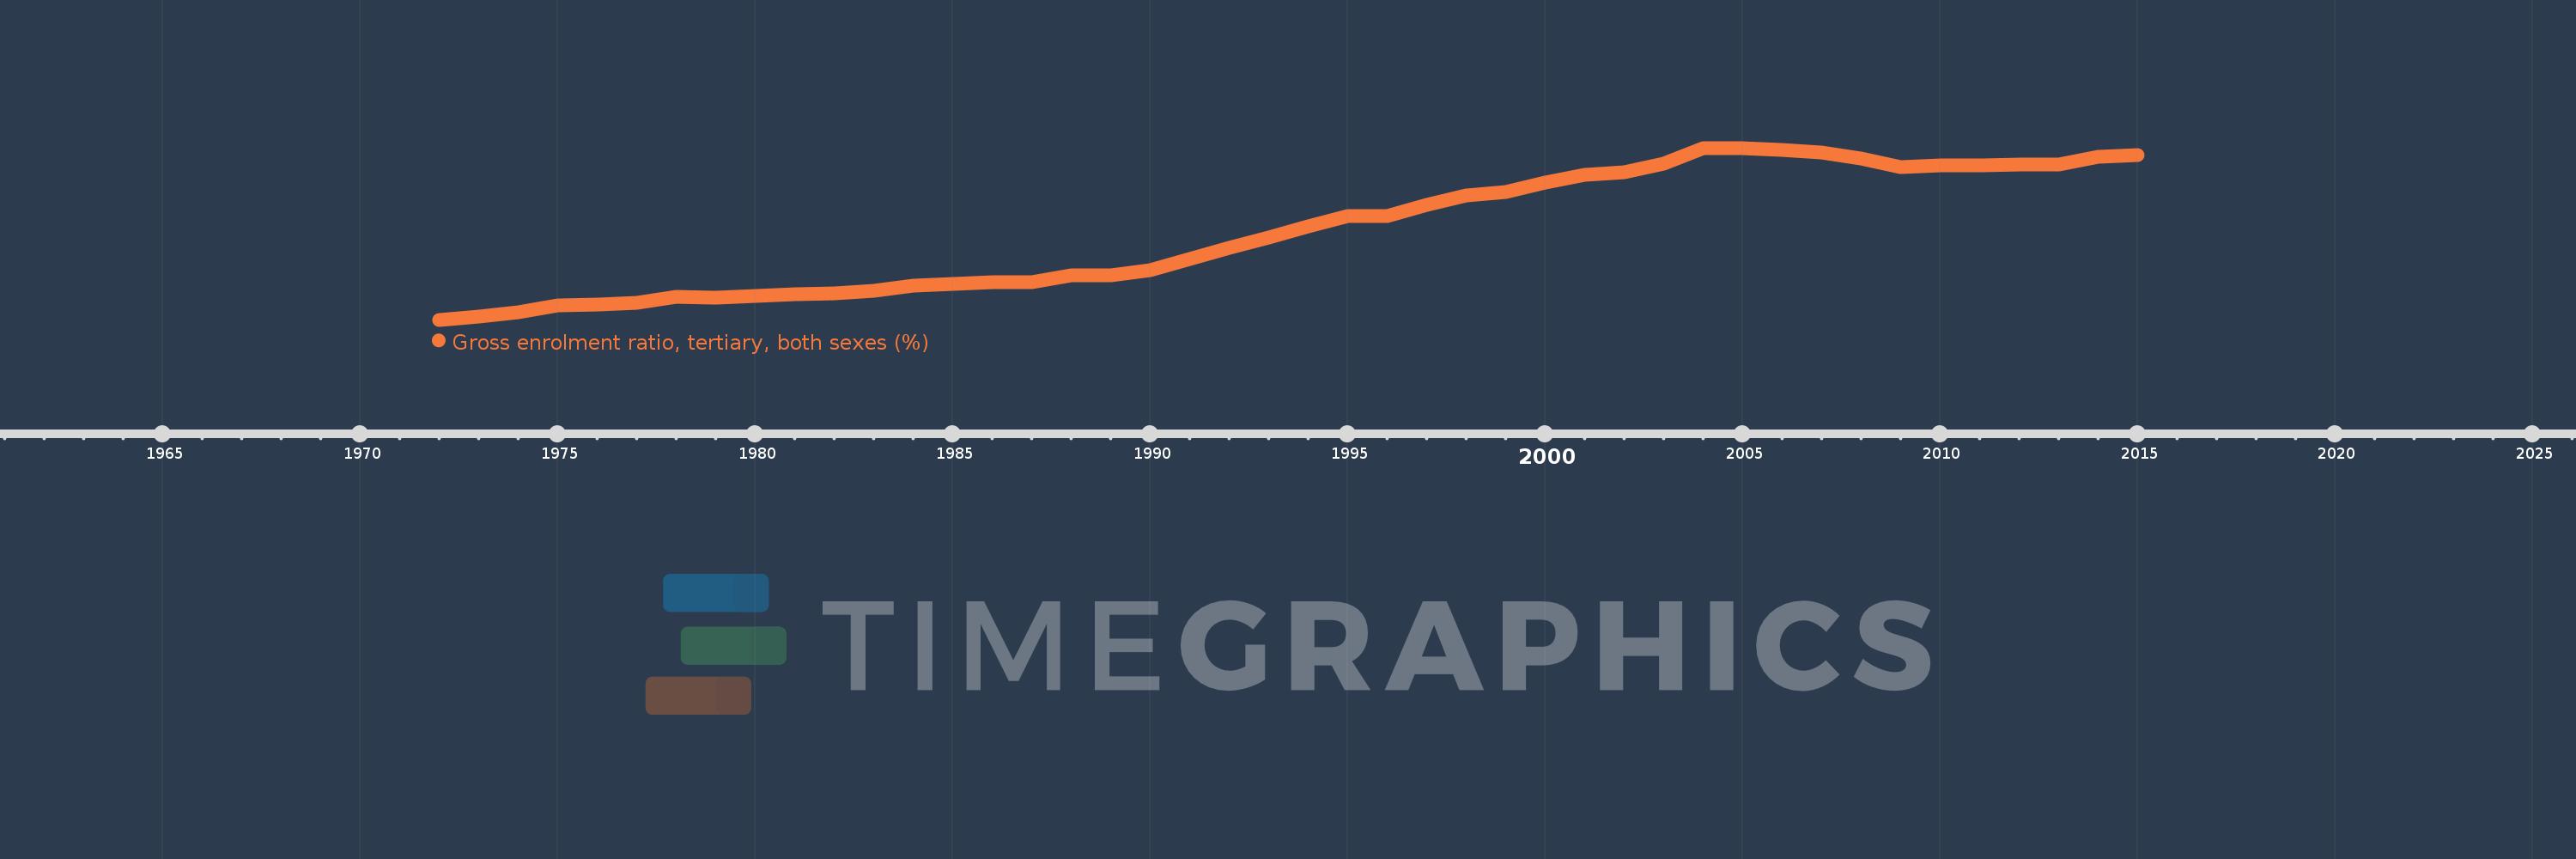
Gross enrolment ratio, tertiary, both sexes (%)
2015,2014,2013,2012,2011,2010,2009,2008,2007,2006,2005,2004,2003,2002,2001,2000,1999,1998,1997,1996,1995,1994,1993,1992,1991,1990,1989,1988,1987,1986,1985,1984,1983,1982,1981,1980,1979,1978,1977,1976,1975,1974,1973,1972
This statistics in other country:
AfghanistanAlbaniaAlgeriaAngolaAntigua and BarbudaArab WorldArgentinaArmeniaArubaAustraliaAustriaAzerbaijanBahamas, TheBahrainBangladeshBarbadosBelarusBelgiumBelizeBeninBermudaBhutanBoliviaBosnia and HerzegovinaBotswanaBrazilBritish Virgin IslandsBrunei DarussalamBulgariaBurkina FasoBurundiCabo VerdeCambodiaCameroonCanadaCaribbean small statesCentral African RepublicCentral Europe and the BalticsChadChileChinaColombiaComorosCongo, Dem. Rep.Congo, Rep.Costa RicaCote d'IvoireCroatiaCubaCuracaoCyprusCzech RepublicDenmarkDjiboutiDominicaDominican RepublicEarly-demographic dividendEast Asia & PacificEast Asia & Pacific (excluding high income)East Asia & Pacific (IDA & IBRD countries)EcuadorEgypt, Arab Rep.El SalvadorEquatorial GuineaEritreaEstoniaEthiopiaEuro areaEurope & Central AsiaEurope & Central Asia (excluding high income)Europe & Central Asia (IDA & IBRD countries)European UnionFijiFinlandFragile and conflict affected situationsFranceGabonGambia, TheGeorgiaGermanyGhanaGreeceGrenadaGuatemalaGuineaGuinea-BissauGuyanaHaitiHeavily indebted poor countries (HIPC)High incomeHondurasHong Kong SAR, ChinaHungaryIBRD onlyIcelandIDA & IBRD totalIDA blendIDA onlyIDA totalIndiaIndonesiaIran, Islamic Rep.IraqIrelandIsraelItalyJamaicaJapanJordanKazakhstanKenyaKorea, Dem. People’s Rep.Korea, Rep.KuwaitKyrgyz RepublicLao PDRLate-demographic dividendLatin America & Caribbean Latin America & Caribbean (excluding high income)Latin America & the Caribbean (IDA & IBRD countries)LatviaLeast developed countries: UN classificationLebanonLesothoLiberiaLibyaLiechtensteinLithuaniaLow & middle incomeLow incomeLower middle incomeLuxembourgMacao SAR, ChinaMacedonia, FYRMadagascarMalawiMalaysiaMaldivesMaliMaltaMarshall IslandsMauritaniaMauritiusMexicoMicronesia, Fed. Sts.Middle East & North AfricaMiddle East & North Africa (excluding high income)Middle East & North Africa (IDA & IBRD countries)Middle incomeMoldovaMongoliaMontenegroMoroccoMozambiqueMyanmarNamibiaNepalNetherlandsNew ZealandNicaraguaNigerNigeriaNorth AmericaNorwayOECD membersOmanOther small statesPacific island small statesPakistanPalauPanamaPapua New GuineaParaguayPeruPhilippinesPolandPortugalPost-demographic dividendPre-demographic dividendPuerto RicoQatarRomaniaRussian FederationRwandaSamoaSan MarinoSao Tome and PrincipeSaudi ArabiaSenegalSerbiaSeychellesSierra LeoneSingaporeSlovak RepublicSloveniaSmall statesSomaliaSouth AfricaSouth AsiaSouth Asia (IDA & IBRD)SpainSri LankaSt. Kitts and NevisSt. LuciaSt. Vincent and the GrenadinesSub-Saharan Africa Sub-Saharan Africa (excluding high income)Sub-Saharan Africa (IDA & IBRD countries)SudanSurinameSwazilandSwedenSwitzerlandSyrian Arab RepublicTajikistanTanzaniaThailandTimor-LesteTogoTongaTrinidad and TobagoTunisiaTurkeyTurkmenistanUgandaUkraineUnited Arab EmiratesUnited KingdomUnited StatesUpper middle incomeUruguayUzbekistanVanuatuVenezuela, RBVietnamWest Bank and GazaWorldYemen, Rep.ZambiaZimbabwe Timeline:
This timeline shows a graph from 1972 to 2015 of Norway. No data until 1971. Number of actual observations by date: 44.
Source name:
World Development Indicators
Source organization:
UNESCO Institute for Statistics
Categories, topics:
Education
Last updated:
apr 23, 2017
Indicators value changes by year
Minimum:
15.795
jan 1, 1972
Maximum:
79.264
jan 1, 2005
At the date of observation
Value
Absolute change
Change from previous value
jan 1, 1972
15.795
+15.795
0.0%
jan 1, 1973
17.039
+1.244
7.88%
jan 1, 1974
18.707
+1.668
9.79%
jan 1, 1975
20.941
+2.233
11.94%
jan 1, 1976
21.373
+0.432
2.06%
jan 1, 1977
22.123
+0.75
3.51%
jan 1, 1978
24.22
+2.097
9.48%
jan 1, 1979
23.899
-0.321
-1.33%
jan 1, 1980
24.585
+0.687
2.87%
jan 1, 1981
25.327
+0.742
3.02%
jan 1, 1982
25.483
+0.157
0.62%
jan 1, 1983
26.497
+1.013
3.98%
jan 1, 1984
28.38
+1.883
7.11%
jan 1, 1985
29.175
+0.795
2.8%
jan 1, 1986
29.81
+0.635
2.18%
jan 1, 1987
29.629
-0.181
-0.61%
jan 1, 1988
32.05
+2.421
8.17%
jan 1, 1989
32.29
+0.24
0.75%
jan 1, 1990
34.252
+1.962
6.08%
jan 1, 1991
38.371
+4.119
12.03%
jan 1, 1992
42.335
+3.964
10.33%
jan 1, 1993
46.012
+3.677
8.69%
jan 1, 1994
50.209
+4.196
9.12%
jan 1, 1995
54.173
+3.964
7.9%
jan 1, 1996
54.204
+0.031
0.06%
jan 1, 1997
58.117
+3.913
7.22%
jan 1, 1998
61.565
+3.447
5.93%
jan 1, 1999
62.868
+1.304
2.12%
jan 1, 2000
66.427
+3.559
5.66%
jan 1, 2001
69.342
+2.915
4.39%
jan 1, 2002
70.28
+0.937
1.35%
jan 1, 2003
73.373
+3.093
4.4%
jan 1, 2004
79.108
+5.735
7.82%
jan 1, 2005
79.264
+0.156
0.2%
jan 1, 2006
78.551
-0.712
-0.9%
jan 1, 2007
77.684
-0.868
-1.1%
jan 1, 2008
75.41
-2.274
-2.93%
jan 1, 2009
72.337
-3.072
-4.07%
jan 1, 2010
72.706
+0.369
0.51%
jan 1, 2011
72.887
+0.18
0.25%
jan 1, 2012
73.086
+0.199
0.27%
jan 1, 2013
73.251
+0.166
0.23%
jan 1, 2014
76.118
+2.866
3.91%
jan 1, 2015
76.783
+0.665
0.87%
Ranking of countries by current statistics by years


Comments: