29
/
en
AIzaSyAYiBZKx7MnpbEhh9jyipgxe19OcubqV5w
April 1, 2024
73377
Australia
AUS
true
2
1
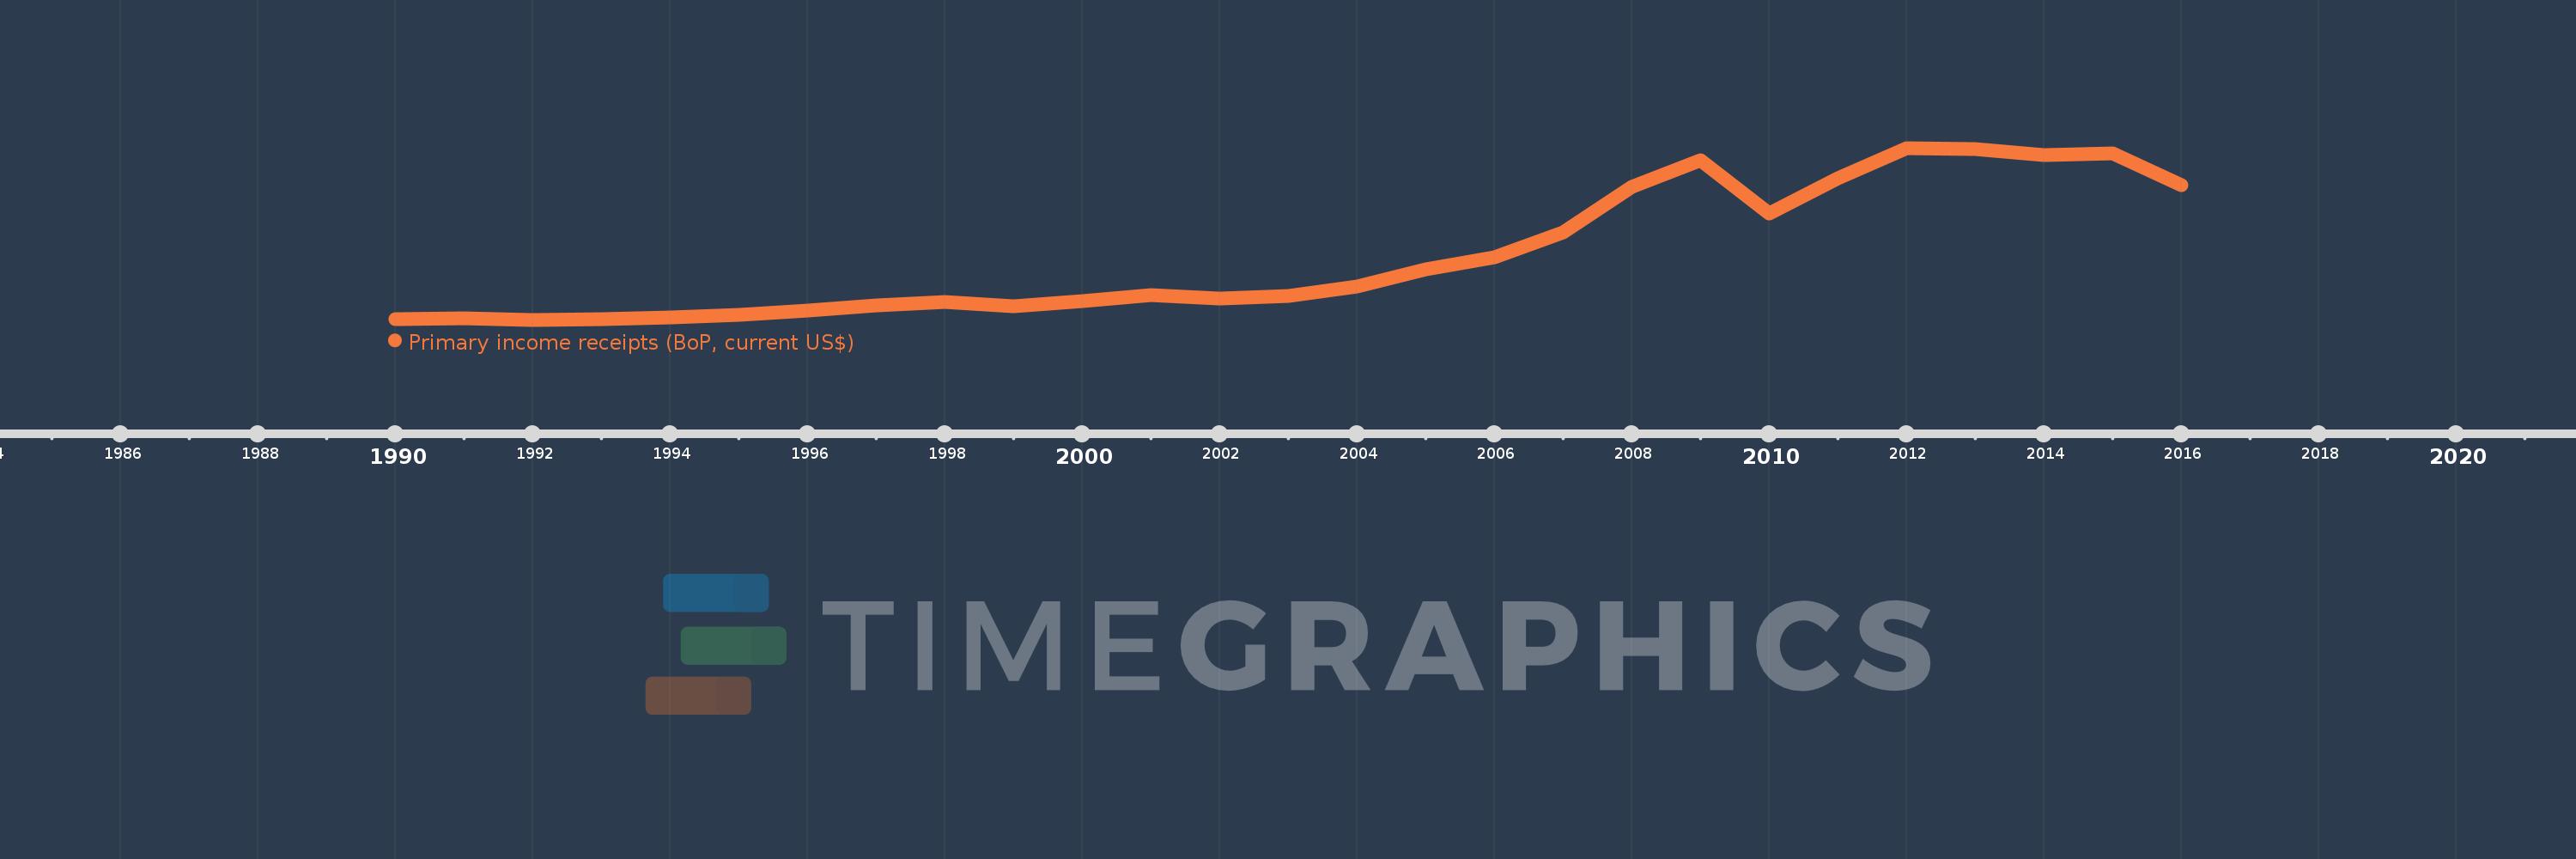
Primary income receipts (BoP, current US$)
2016,2015,2014,2013,2012,2011,2010,2009,2008,2007,2006,2005,2004,2003,2002,2001,2000,1999,1998,1997,1996,1995,1994,1993,1992,1991,1990
This statistics in other country:
AfghanistanAlbaniaAlgeriaAngolaAntigua and BarbudaArab WorldArgentinaArmeniaArubaAustraliaAustriaAzerbaijanBahamas, TheBahrainBangladeshBarbadosBelarusBelgiumBelizeBeninBermudaBhutanBoliviaBosnia and HerzegovinaBotswanaBrazilBrunei DarussalamBulgariaBurkina FasoBurundiCabo VerdeCambodiaCameroonCanadaCaribbean small statesCentral African RepublicCentral Europe and the BalticsChadChileChinaColombiaComorosCongo, Dem. Rep.Congo, Rep.Costa RicaCote d'IvoireCroatiaCuracaoCyprusCzech RepublicDenmarkDjiboutiDominicaDominican RepublicEarly-demographic dividendEast Asia & PacificEast Asia & Pacific (excluding high income)East Asia & Pacific (IDA & IBRD countries)EcuadorEgypt, Arab Rep.El SalvadorEquatorial GuineaEritreaEstoniaEthiopiaEuro areaEurope & Central AsiaEurope & Central Asia (excluding high income)Europe & Central Asia (IDA & IBRD countries)European UnionFaroe IslandsFijiFinlandFragile and conflict affected situationsFranceFrench PolynesiaGabonGambia, TheGeorgiaGermanyGhanaGreeceGrenadaGuatemalaGuineaGuinea-BissauGuyanaHaitiHeavily indebted poor countries (HIPC)High incomeHondurasHong Kong SAR, ChinaHungaryIBRD onlyIcelandIDA & IBRD totalIDA blendIDA onlyIDA totalIndiaIndonesiaIran, Islamic Rep.IraqIrelandIsraelItalyJamaicaJapanJordanKazakhstanKenyaKiribatiKorea, Rep.KosovoKuwaitKyrgyz RepublicLao PDRLate-demographic dividendLatin America & Caribbean Latin America & Caribbean (excluding high income)Latin America & the Caribbean (IDA & IBRD countries)LatviaLeast developed countries: UN classificationLebanonLesothoLiberiaLibyaLithuaniaLow & middle incomeLow incomeLower middle incomeLuxembourgMacao SAR, ChinaMacedonia, FYRMadagascarMalawiMalaysiaMaldivesMaliMaltaMarshall IslandsMauritaniaMauritiusMexicoMicronesia, Fed. Sts.Middle East & North AfricaMiddle East & North Africa (excluding high income)Middle East & North Africa (IDA & IBRD countries)Middle incomeMoldovaMongoliaMontenegroMoroccoMozambiqueMyanmarNamibiaNepalNetherlandsNew CaledoniaNew ZealandNicaraguaNigerNigeriaNorth AmericaNorwayOECD membersOmanOther small statesPacific island small statesPakistanPalauPanamaPapua New GuineaParaguayPeruPhilippinesPolandPortugalPost-demographic dividendPre-demographic dividendQatarRomaniaRussian FederationRwandaSamoaSao Tome and PrincipeSaudi ArabiaSenegalSerbiaSeychellesSierra LeoneSingaporeSint Maarten (Dutch part)Slovak RepublicSloveniaSmall statesSolomon IslandsSouth AfricaSouth AsiaSouth Asia (IDA & IBRD)South SudanSpainSri LankaSt. Kitts and NevisSt. LuciaSt. Vincent and the GrenadinesSub-Saharan Africa Sub-Saharan Africa (excluding high income)Sub-Saharan Africa (IDA & IBRD countries)SudanSurinameSwazilandSwedenSwitzerlandSyrian Arab RepublicTajikistanTanzaniaThailandTimor-LesteTogoTongaTrinidad and TobagoTunisiaTurkeyTuvaluUgandaUkraineUnited KingdomUnited StatesUpper middle incomeUruguayVanuatuVenezuela, RBVietnamWest Bank and GazaWorldYemen, Rep.ZambiaZimbabwe Timeline:
This timeline shows a graph from 1990 to 2016 of Australia. No data until 1989. Number of actual observations by date: 27.
Source name:
World Development Indicators
Source organization:
International Monetary Fund, Balance of Payments Statistics Yearbook and data files.
Categories, topics:
Economy & Growth
Last updated:
apr 23, 2017
Indicators value changes by year
Minimum:
3.702 bln
jan 1, 1992
Maximum:
47.974 bln
jan 1, 2012
At the date of observation
Value
Absolute change
Change from previous value
jan 1, 1990
3.908 bln
+3.908 bln
0.0%
jan 1, 1991
4.001 bln
+93.187 mln
2.38%
jan 1, 1992
3.702 bln
-299.807 mln
-7.49%
jan 1, 1993
3.761 bln
+59.424 mln
1.61%
jan 1, 1994
4.209 bln
+448.302 mln
11.92%
jan 1, 1995
4.981 bln
+771.162 mln
18.32%
jan 1, 1996
6.072 bln
+1.092 bln
21.92%
jan 1, 1997
7.4 bln
+1.328 bln
21.87%
jan 1, 1998
8.214 bln
+813.82 mln
11.0%
jan 1, 1999
7.145 bln
-1.069 bln
-13.01%
jan 1, 2000
8.43 bln
+1.285 bln
17.98%
jan 1, 2001
10.038 bln
+1.609 bln
19.08%
jan 1, 2002
9.194 bln
-844.367 mln
-8.41%
jan 1, 2003
9.89 bln
+696.102 mln
7.57%
jan 1, 2004
12.206 bln
+2.316 bln
23.42%
jan 1, 2005
16.683 bln
+4.477 bln
36.68%
jan 1, 2006
19.828 bln
+3.145 bln
18.85%
jan 1, 2007
26.298 bln
+6.47 bln
32.63%
jan 1, 2008
37.976 bln
+11.677 bln
44.4%
jan 1, 2009
44.713 bln
+6.737 bln
17.74%
jan 1, 2010
31.066 bln
-13.647 bln
-30.52%
jan 1, 2011
40.05 bln
+8.984 bln
28.92%
jan 1, 2012
47.974 bln
+7.924 bln
19.78%
jan 1, 2013
47.604 bln
-369.588 mln
-0.77%
jan 1, 2014
46.23 bln
-1.374 bln
-2.89%
jan 1, 2015
46.573 bln
+342.638 mln
0.74%
jan 1, 2016
38.429 bln
-8.143 bln
-17.49%
Ranking of countries by current statistics by years


Comments: