29
/
en
AIzaSyAYiBZKx7MnpbEhh9jyipgxe19OcubqV5w
April 1, 2024
281593
Venezuela, RB
VEN
true
2
1
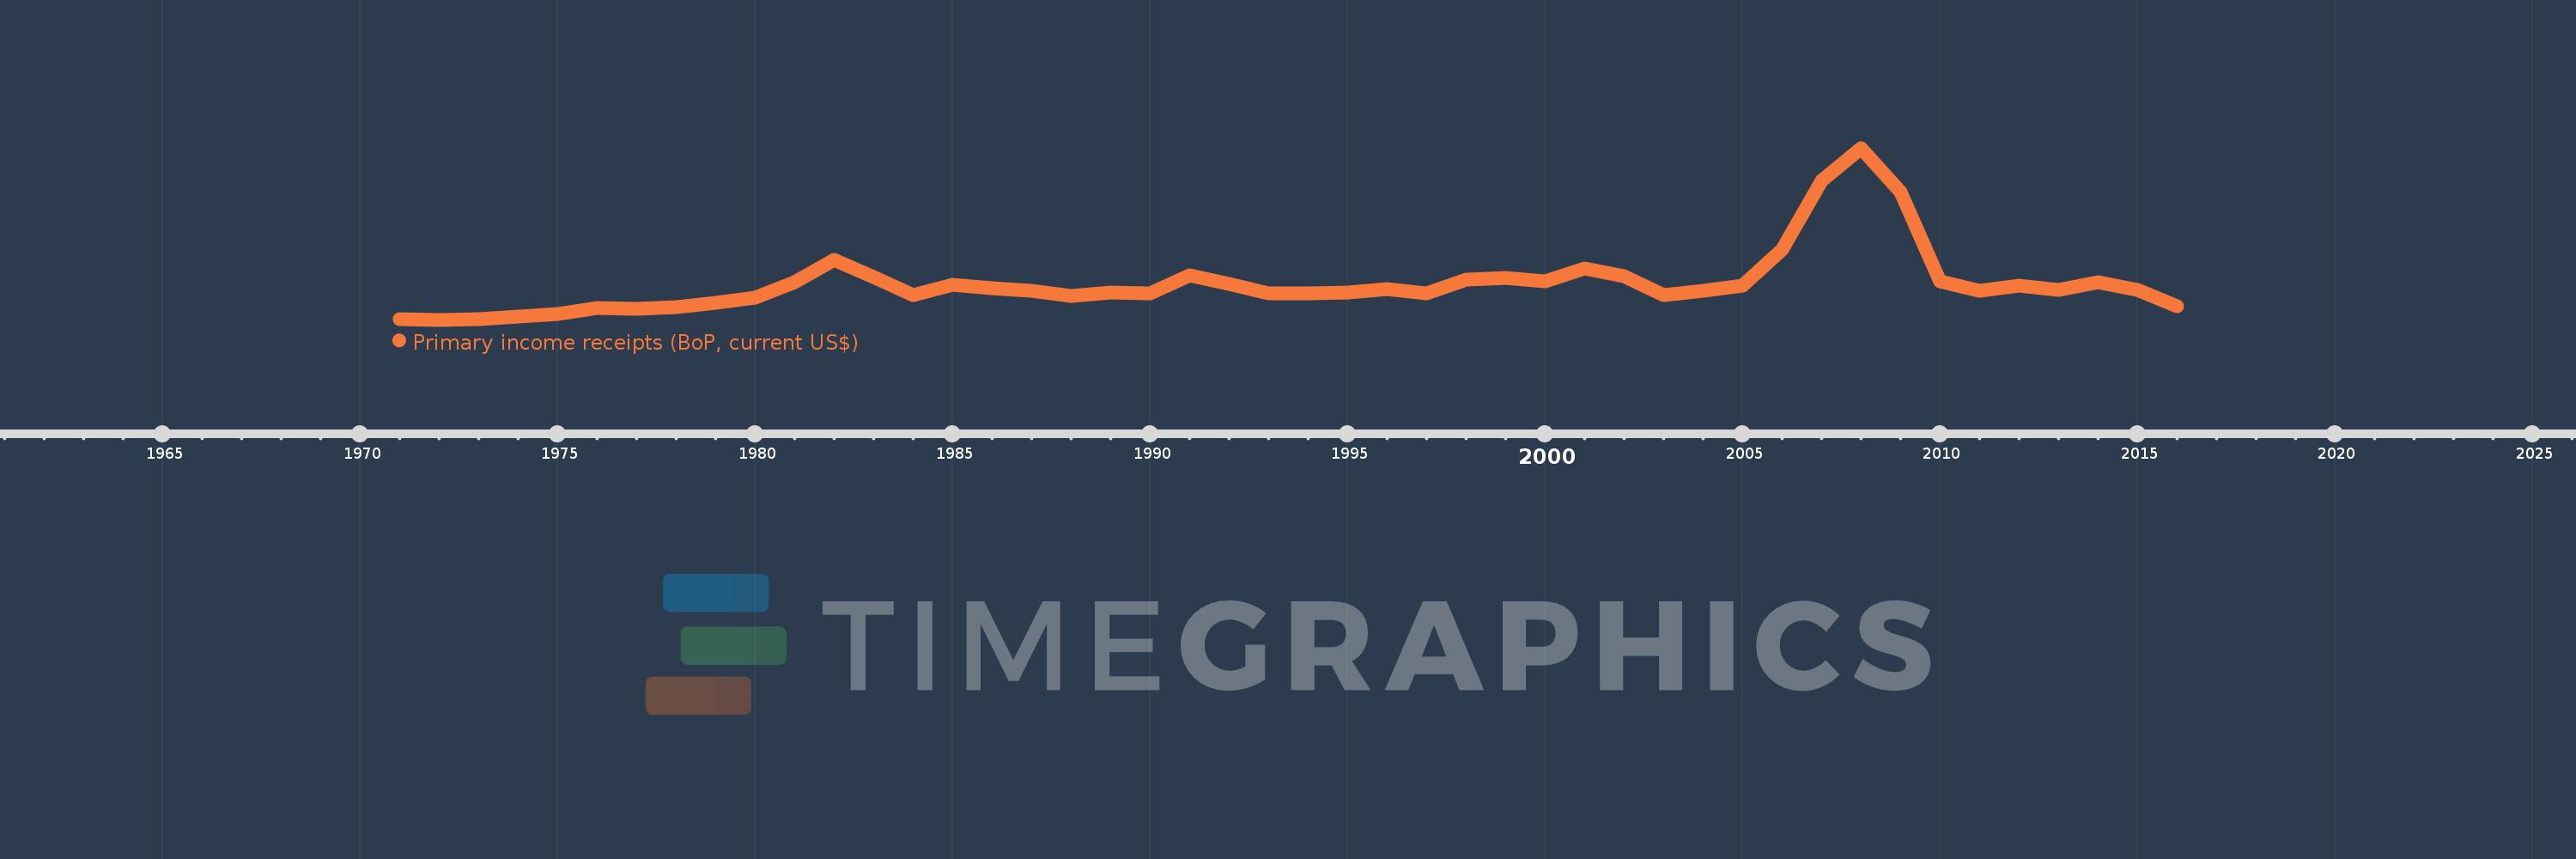
Primary income receipts (BoP, current US$)
2016,2015,2014,2013,2012,2011,2010,2009,2008,2007,2006,2005,2004,2003,2002,2001,2000,1999,1998,1997,1996,1995,1994,1993,1992,1991,1990,1989,1988,1987,1986,1985,1984,1983,1982,1981,1980,1979,1978,1977,1976,1975,1974,1973,1972,1971
This statistics in other country:
AfghanistanAlbaniaAlgeriaAngolaAntigua and BarbudaArab WorldArgentinaArmeniaArubaAustraliaAustriaAzerbaijanBahamas, TheBahrainBangladeshBarbadosBelarusBelgiumBelizeBeninBermudaBhutanBoliviaBosnia and HerzegovinaBotswanaBrazilBrunei DarussalamBulgariaBurkina FasoBurundiCabo VerdeCambodiaCameroonCanadaCaribbean small statesCentral African RepublicCentral Europe and the BalticsChadChileChinaColombiaComorosCongo, Dem. Rep.Congo, Rep.Costa RicaCote d'IvoireCroatiaCuracaoCyprusCzech RepublicDenmarkDjiboutiDominicaDominican RepublicEarly-demographic dividendEast Asia & PacificEast Asia & Pacific (excluding high income)East Asia & Pacific (IDA & IBRD countries)EcuadorEgypt, Arab Rep.El SalvadorEquatorial GuineaEritreaEstoniaEthiopiaEuro areaEurope & Central AsiaEurope & Central Asia (excluding high income)Europe & Central Asia (IDA & IBRD countries)European UnionFaroe IslandsFijiFinlandFragile and conflict affected situationsFranceFrench PolynesiaGabonGambia, TheGeorgiaGermanyGhanaGreeceGrenadaGuatemalaGuineaGuinea-BissauGuyanaHaitiHeavily indebted poor countries (HIPC)High incomeHondurasHong Kong SAR, ChinaHungaryIBRD onlyIcelandIDA & IBRD totalIDA blendIDA onlyIDA totalIndiaIndonesiaIran, Islamic Rep.IraqIrelandIsraelItalyJamaicaJapanJordanKazakhstanKenyaKiribatiKorea, Rep.KosovoKuwaitKyrgyz RepublicLao PDRLate-demographic dividendLatin America & Caribbean Latin America & Caribbean (excluding high income)Latin America & the Caribbean (IDA & IBRD countries)LatviaLeast developed countries: UN classificationLebanonLesothoLiberiaLibyaLithuaniaLow & middle incomeLow incomeLower middle incomeLuxembourgMacao SAR, ChinaMacedonia, FYRMadagascarMalawiMalaysiaMaldivesMaliMaltaMarshall IslandsMauritaniaMauritiusMexicoMicronesia, Fed. Sts.Middle East & North AfricaMiddle East & North Africa (excluding high income)Middle East & North Africa (IDA & IBRD countries)Middle incomeMoldovaMongoliaMontenegroMoroccoMozambiqueMyanmarNamibiaNepalNetherlandsNew CaledoniaNew ZealandNicaraguaNigerNigeriaNorth AmericaNorwayOECD membersOmanOther small statesPacific island small statesPakistanPalauPanamaPapua New GuineaParaguayPeruPhilippinesPolandPortugalPost-demographic dividendPre-demographic dividendQatarRomaniaRussian FederationRwandaSamoaSao Tome and PrincipeSaudi ArabiaSenegalSerbiaSeychellesSierra LeoneSingaporeSint Maarten (Dutch part)Slovak RepublicSloveniaSmall statesSolomon IslandsSouth AfricaSouth AsiaSouth Asia (IDA & IBRD)South SudanSpainSri LankaSt. Kitts and NevisSt. LuciaSt. Vincent and the GrenadinesSub-Saharan Africa Sub-Saharan Africa (excluding high income)Sub-Saharan Africa (IDA & IBRD countries)SudanSurinameSwazilandSwedenSwitzerlandSyrian Arab RepublicTajikistanTanzaniaThailandTimor-LesteTogoTongaTrinidad and TobagoTunisiaTurkeyTuvaluUgandaUkraineUnited KingdomUnited StatesUpper middle incomeUruguayVanuatuVenezuela, RBVietnamWest Bank and GazaWorldYemen, Rep.ZambiaZimbabwe Timeline:
This timeline shows a graph from 1971 to 2016 of Venezuela, RB. No data until 1970. Number of actual observations by date: 46.
Source name:
World Development Indicators
Source organization:
International Monetary Fund, Balance of Payments Statistics Yearbook and data files.
Categories, topics:
Economy & Growth
Last updated:
apr 23, 2017
Indicators value changes by year
Minimum:
39.0 mln
jan 1, 1972
Maximum:
10.14 bln
jan 1, 2008
At the date of observation
Value
Absolute change
Change from previous value
jan 1, 1971
54.0 mln
+54.0 mln
0.0%
jan 1, 1972
39.0 mln
-15.0 mln
-27.78%
jan 1, 1973
57.0 mln
+18.0 mln
46.15%
jan 1, 1974
229.0 mln
+172.0 mln
301.75%
jan 1, 1975
356.0 mln
+127.0 mln
55.46%
jan 1, 1976
740.0 mln
+384.0 mln
107.87%
jan 1, 1977
693.0 mln
-47.0 mln
-6.35%
jan 1, 1978
782.0 mln
+89.0 mln
12.84%
jan 1, 1979
1.052 bln
+270.0 mln
34.53%
jan 1, 1980
1.346 bln
+294.0 mln
27.95%
jan 1, 1981
2.264 bln
+918.0 mln
68.2%
jan 1, 1982
3.581 bln
+1.317 bln
58.17%
jan 1, 1983
2.565 bln
-1.016 bln
-28.37%
jan 1, 1984
1.5 bln
-1.065 bln
-41.52%
jan 1, 1985
2.097 bln
+597.0 mln
39.8%
jan 1, 1986
1.914 bln
-183.0 mln
-8.73%
jan 1, 1987
1.761 bln
-153.0 mln
-7.99%
jan 1, 1988
1.455 bln
-306.0 mln
-17.38%
jan 1, 1989
1.653 bln
+198.0 mln
13.61%
jan 1, 1990
1.582 bln
-71.0 mln
-4.3%
jan 1, 1991
2.658 bln
+1.076 bln
68.02%
jan 1, 1992
2.168 bln
-490.0 mln
-18.43%
jan 1, 1993
1.607 bln
-561.0 mln
-25.88%
jan 1, 1994
1.599 bln
-8.0 mln
-0.5%
jan 1, 1995
1.626 bln
+27.0 mln
1.69%
jan 1, 1996
1.867 bln
+241.0 mln
14.82%
jan 1, 1997
1.579 bln
-288.0 mln
-15.43%
jan 1, 1998
2.421 bln
+842.0 mln
53.32%
jan 1, 1999
2.479 bln
+58.0 mln
2.4%
jan 1, 2000
2.272 bln
-207.0 mln
-8.35%
jan 1, 2001
3.049 bln
+777.0 mln
34.2%
jan 1, 2002
2.603 bln
-446.0 mln
-14.63%
jan 1, 2003
1.474 bln
-1.129 bln
-43.37%
jan 1, 2004
1.729 bln
+255.0 mln
17.3%
jan 1, 2005
2.05 bln
+321.0 mln
18.57%
jan 1, 2006
4.15 bln
+2.1 bln
102.44%
jan 1, 2007
8.226 bln
+4.076 bln
98.22%
jan 1, 2008
10.14 bln
+1.914 bln
23.27%
jan 1, 2009
7.539 bln
-2.601 bln
-25.65%
jan 1, 2010
2.297 bln
-5.242 bln
-69.53%
jan 1, 2011
1.75 bln
-547.0 mln
-23.81%
jan 1, 2012
2.023 bln
+273.0 mln
15.6%
jan 1, 2013
1.777 bln
-246.0 mln
-12.16%
jan 1, 2014
2.223 bln
+446.0 mln
25.1%
jan 1, 2015
1.815 bln
-408.0 mln
-18.35%
jan 1, 2016
850.0 mln
-965.0 mln
-53.17%
Ranking of countries by current statistics by years


Comments: