29
/
en
AIzaSyAYiBZKx7MnpbEhh9jyipgxe19OcubqV5w
April 1, 2024
48496
Middle East & North Africa
MEA
false
2
1
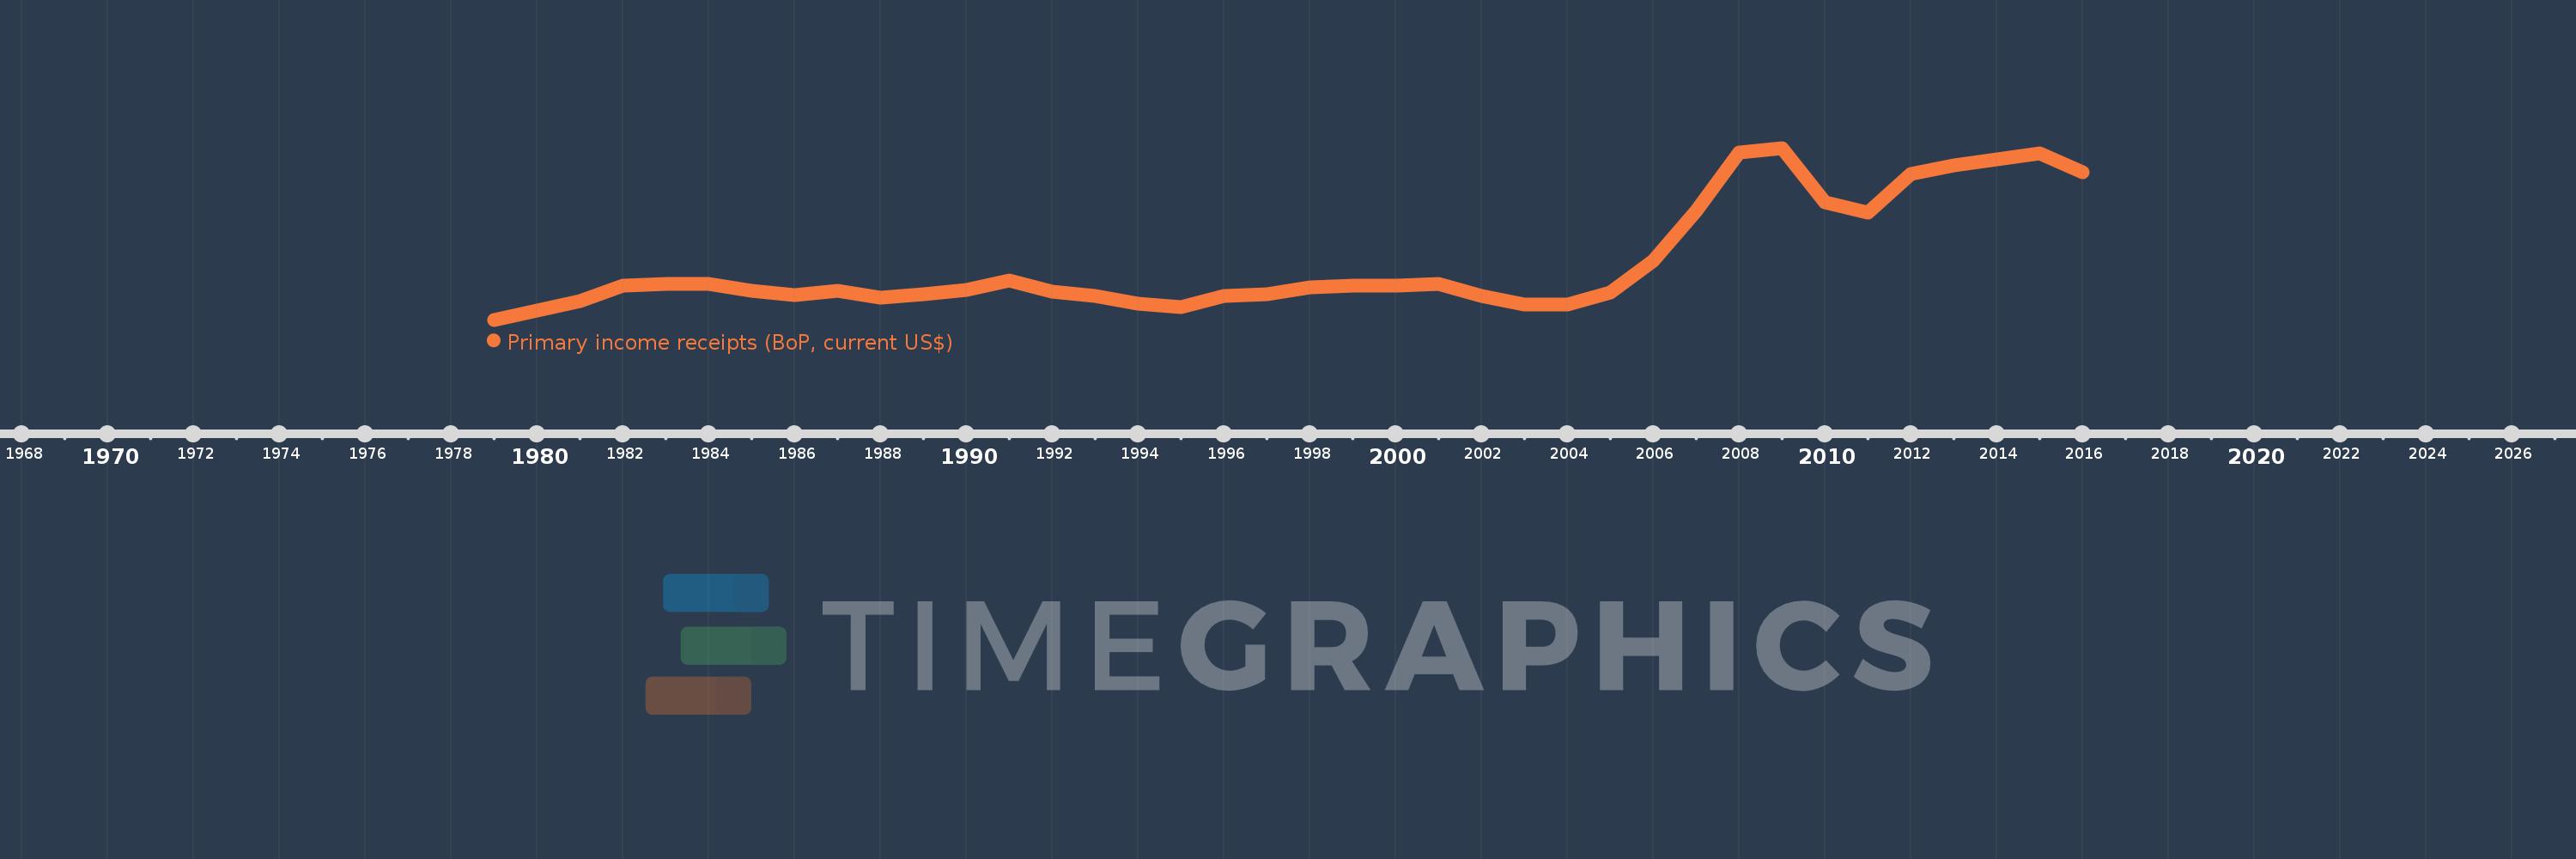
Primary income receipts (BoP, current US$)
2016,2015,2014,2013,2012,2011,2010,2009,2008,2007,2006,2005,2004,2003,2002,2001,2000,1999,1998,1997,1996,1995,1994,1993,1992,1991,1990,1989,1988,1987,1986,1985,1984,1983,1982,1981,1979
This statistics in other country:
AfghanistanAlbaniaAlgeriaAngolaAntigua and BarbudaArab WorldArgentinaArmeniaArubaAustraliaAustriaAzerbaijanBahamas, TheBahrainBangladeshBarbadosBelarusBelgiumBelizeBeninBermudaBhutanBoliviaBosnia and HerzegovinaBotswanaBrazilBrunei DarussalamBulgariaBurkina FasoBurundiCabo VerdeCambodiaCameroonCanadaCaribbean small statesCentral African RepublicCentral Europe and the BalticsChadChileChinaColombiaComorosCongo, Dem. Rep.Congo, Rep.Costa RicaCote d'IvoireCroatiaCuracaoCyprusCzech RepublicDenmarkDjiboutiDominicaDominican RepublicEarly-demographic dividendEast Asia & PacificEast Asia & Pacific (excluding high income)East Asia & Pacific (IDA & IBRD countries)EcuadorEgypt, Arab Rep.El SalvadorEquatorial GuineaEritreaEstoniaEthiopiaEuro areaEurope & Central AsiaEurope & Central Asia (excluding high income)Europe & Central Asia (IDA & IBRD countries)European UnionFaroe IslandsFijiFinlandFragile and conflict affected situationsFranceFrench PolynesiaGabonGambia, TheGeorgiaGermanyGhanaGreeceGrenadaGuatemalaGuineaGuinea-BissauGuyanaHaitiHeavily indebted poor countries (HIPC)High incomeHondurasHong Kong SAR, ChinaHungaryIBRD onlyIcelandIDA & IBRD totalIDA blendIDA onlyIDA totalIndiaIndonesiaIran, Islamic Rep.IraqIrelandIsraelItalyJamaicaJapanJordanKazakhstanKenyaKiribatiKorea, Rep.KosovoKuwaitKyrgyz RepublicLao PDRLate-demographic dividendLatin America & Caribbean Latin America & Caribbean (excluding high income)Latin America & the Caribbean (IDA & IBRD countries)LatviaLeast developed countries: UN classificationLebanonLesothoLiberiaLibyaLithuaniaLow & middle incomeLow incomeLower middle incomeLuxembourgMacao SAR, ChinaMacedonia, FYRMadagascarMalawiMalaysiaMaldivesMaliMaltaMarshall IslandsMauritaniaMauritiusMexicoMicronesia, Fed. Sts.Middle East & North AfricaMiddle East & North Africa (excluding high income)Middle East & North Africa (IDA & IBRD countries)Middle incomeMoldovaMongoliaMontenegroMoroccoMozambiqueMyanmarNamibiaNepalNetherlandsNew CaledoniaNew ZealandNicaraguaNigerNigeriaNorth AmericaNorwayOECD membersOmanOther small statesPacific island small statesPakistanPalauPanamaPapua New GuineaParaguayPeruPhilippinesPolandPortugalPost-demographic dividendPre-demographic dividendQatarRomaniaRussian FederationRwandaSamoaSao Tome and PrincipeSaudi ArabiaSenegalSerbiaSeychellesSierra LeoneSingaporeSint Maarten (Dutch part)Slovak RepublicSloveniaSmall statesSolomon IslandsSouth AfricaSouth AsiaSouth Asia (IDA & IBRD)South SudanSpainSri LankaSt. Kitts and NevisSt. LuciaSt. Vincent and the GrenadinesSub-Saharan Africa Sub-Saharan Africa (excluding high income)Sub-Saharan Africa (IDA & IBRD countries)SudanSurinameSwazilandSwedenSwitzerlandSyrian Arab RepublicTajikistanTanzaniaThailandTimor-LesteTogoTongaTrinidad and TobagoTunisiaTurkeyTuvaluUgandaUkraineUnited KingdomUnited StatesUpper middle incomeUruguayVanuatuVenezuela, RBVietnamWest Bank and GazaWorldYemen, Rep.ZambiaZimbabwe Timeline:
This timeline shows a graph from 1979 to 2016 of Middle East & North Africa. No data until 1978. Number of actual observations by date: 37.
Source name:
World Development Indicators
Source organization:
International Monetary Fund, Balance of Payments Statistics Yearbook and data files.
Categories, topics:
Economy & Growth
Last updated:
apr 23, 2017
Indicators value changes by year
Minimum:
10.261 bln
jan 1, 1979
Maximum:
89.419 bln
jan 1, 2009
At the date of observation
Value
Absolute change
Change from previous value
jan 1, 1979
10.261 bln
+10.261 bln
0.0%
jan 1, 1981
18.731 bln
+8.471 bln
82.56%
jan 1, 1982
26.143 bln
+7.411 bln
39.57%
jan 1, 1983
26.612 bln
+469.243 mln
1.79%
jan 1, 1984
26.734 bln
+122.316 mln
0.46%
jan 1, 1985
23.77 bln
-2.964 bln
-11.09%
jan 1, 1986
21.562 bln
-2.208 bln
-9.29%
jan 1, 1987
23.502 bln
+1.94 bln
9.0%
jan 1, 1988
20.54 bln
-2.961 bln
-12.6%
jan 1, 1989
22.199 bln
+1.659 bln
8.08%
jan 1, 1990
24.117 bln
+1.918 bln
8.64%
jan 1, 1991
28.23 bln
+4.113 bln
17.05%
jan 1, 1992
23.217 bln
-5.013 bln
-17.76%
jan 1, 1993
21.129 bln
-2.088 bln
-8.99%
jan 1, 1994
17.62 bln
-3.509 bln
-16.61%
jan 1, 1995
15.9 bln
-1.72 bln
-9.76%
jan 1, 1996
21.359 bln
+5.459 bln
34.33%
jan 1, 1997
21.995 bln
+636.759 mln
2.98%
jan 1, 1998
25.162 bln
+3.166 bln
14.4%
jan 1, 1999
25.823 bln
+661.06 mln
2.63%
jan 1, 2000
25.808 bln
-14.333 mln
-0.06%
jan 1, 2001
26.779 bln
+970.096 mln
3.76%
jan 1, 2002
21.284 bln
-5.495 bln
-20.52%
jan 1, 2003
17.071 bln
-4.213 bln
-19.79%
jan 1, 2004
17.383 bln
+311.739 mln
1.83%
jan 1, 2005
22.929 bln
+5.546 bln
31.9%
jan 1, 2006
37.254 bln
+14.325 bln
62.48%
jan 1, 2007
60.277 bln
+23.023 bln
61.8%
jan 1, 2008
87.197 bln
+26.92 bln
44.66%
jan 1, 2009
89.419 bln
+2.223 bln
2.55%
jan 1, 2010
64.458 bln
-24.961 bln
-27.91%
jan 1, 2011
59.561 bln
-4.897 bln
-7.6%
jan 1, 2012
77.494 bln
+17.933 bln
30.11%
jan 1, 2013
81.442 bln
+3.948 bln
5.09%
jan 1, 2014
84.097 bln
+2.655 bln
3.26%
jan 1, 2015
86.807 bln
+2.71 bln
3.22%
jan 1, 2016
78.413 bln
-8.394 bln
-9.67%
Ranking of countries by current statistics by years


Comments: