29
/
en
AIzaSyAYiBZKx7MnpbEhh9jyipgxe19OcubqV5w
April 1, 2024
224217
Philippines
PHL
true
2
1
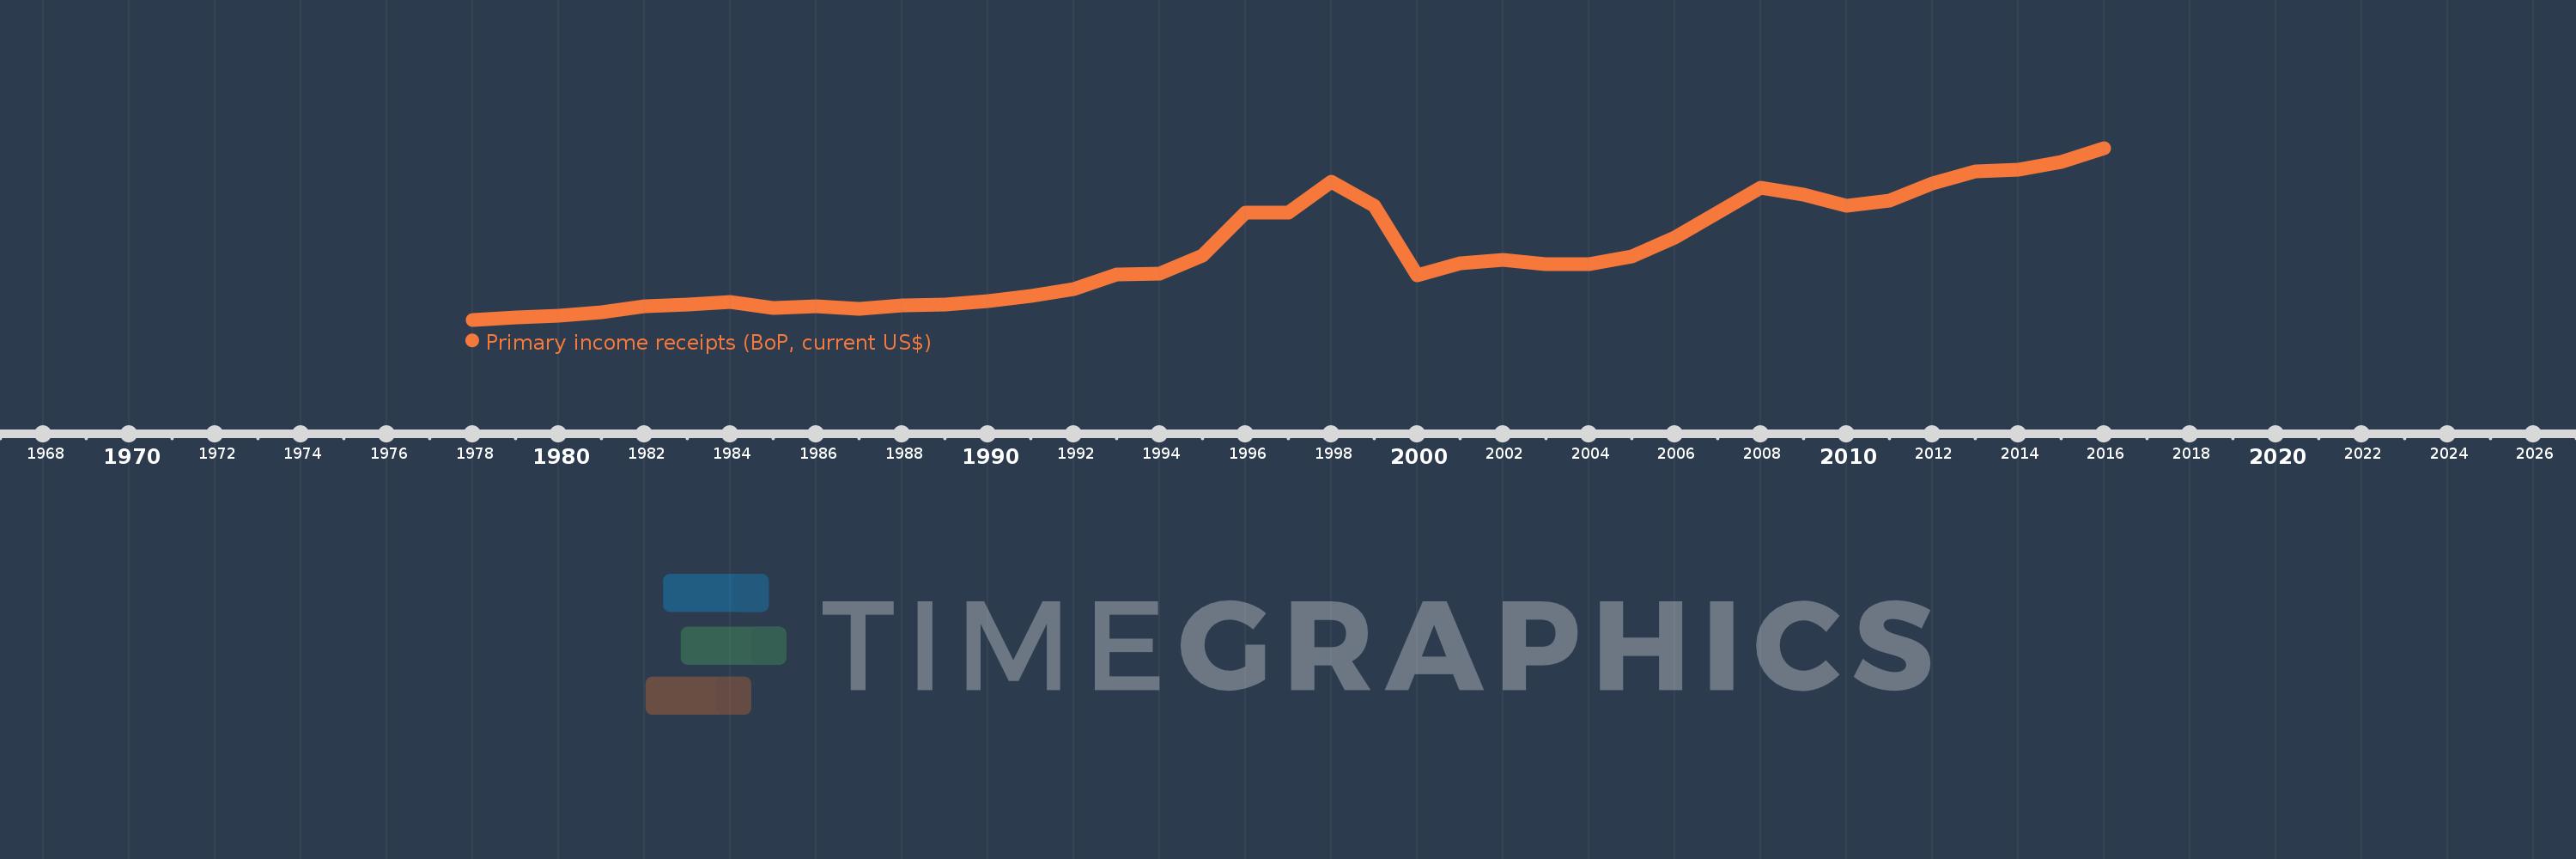
Primary income receipts (BoP, current US$)
2016,2015,2014,2013,2012,2011,2010,2009,2008,2007,2006,2005,2004,2003,2002,2001,2000,1999,1998,1997,1996,1995,1994,1993,1992,1991,1990,1989,1988,1987,1986,1985,1984,1983,1982,1981,1980,1979,1978
This statistics in other country:
AfghanistanAlbaniaAlgeriaAngolaAntigua and BarbudaArab WorldArgentinaArmeniaArubaAustraliaAustriaAzerbaijanBahamas, TheBahrainBangladeshBarbadosBelarusBelgiumBelizeBeninBermudaBhutanBoliviaBosnia and HerzegovinaBotswanaBrazilBrunei DarussalamBulgariaBurkina FasoBurundiCabo VerdeCambodiaCameroonCanadaCaribbean small statesCentral African RepublicCentral Europe and the BalticsChadChileChinaColombiaComorosCongo, Dem. Rep.Congo, Rep.Costa RicaCote d'IvoireCroatiaCuracaoCyprusCzech RepublicDenmarkDjiboutiDominicaDominican RepublicEarly-demographic dividendEast Asia & PacificEast Asia & Pacific (excluding high income)East Asia & Pacific (IDA & IBRD countries)EcuadorEgypt, Arab Rep.El SalvadorEquatorial GuineaEritreaEstoniaEthiopiaEuro areaEurope & Central AsiaEurope & Central Asia (excluding high income)Europe & Central Asia (IDA & IBRD countries)European UnionFaroe IslandsFijiFinlandFragile and conflict affected situationsFranceFrench PolynesiaGabonGambia, TheGeorgiaGermanyGhanaGreeceGrenadaGuatemalaGuineaGuinea-BissauGuyanaHaitiHeavily indebted poor countries (HIPC)High incomeHondurasHong Kong SAR, ChinaHungaryIBRD onlyIcelandIDA & IBRD totalIDA blendIDA onlyIDA totalIndiaIndonesiaIran, Islamic Rep.IraqIrelandIsraelItalyJamaicaJapanJordanKazakhstanKenyaKiribatiKorea, Rep.KosovoKuwaitKyrgyz RepublicLao PDRLate-demographic dividendLatin America & Caribbean Latin America & Caribbean (excluding high income)Latin America & the Caribbean (IDA & IBRD countries)LatviaLeast developed countries: UN classificationLebanonLesothoLiberiaLibyaLithuaniaLow & middle incomeLow incomeLower middle incomeLuxembourgMacao SAR, ChinaMacedonia, FYRMadagascarMalawiMalaysiaMaldivesMaliMaltaMarshall IslandsMauritaniaMauritiusMexicoMicronesia, Fed. Sts.Middle East & North AfricaMiddle East & North Africa (excluding high income)Middle East & North Africa (IDA & IBRD countries)Middle incomeMoldovaMongoliaMontenegroMoroccoMozambiqueMyanmarNamibiaNepalNetherlandsNew CaledoniaNew ZealandNicaraguaNigerNigeriaNorth AmericaNorwayOECD membersOmanOther small statesPacific island small statesPakistanPalauPanamaPapua New GuineaParaguayPeruPhilippinesPolandPortugalPost-demographic dividendPre-demographic dividendQatarRomaniaRussian FederationRwandaSamoaSao Tome and PrincipeSaudi ArabiaSenegalSerbiaSeychellesSierra LeoneSingaporeSint Maarten (Dutch part)Slovak RepublicSloveniaSmall statesSolomon IslandsSouth AfricaSouth AsiaSouth Asia (IDA & IBRD)South SudanSpainSri LankaSt. Kitts and NevisSt. LuciaSt. Vincent and the GrenadinesSub-Saharan Africa Sub-Saharan Africa (excluding high income)Sub-Saharan Africa (IDA & IBRD countries)SudanSurinameSwazilandSwedenSwitzerlandSyrian Arab RepublicTajikistanTanzaniaThailandTimor-LesteTogoTongaTrinidad and TobagoTunisiaTurkeyTuvaluUgandaUkraineUnited KingdomUnited StatesUpper middle incomeUruguayVanuatuVenezuela, RBVietnamWest Bank and GazaWorldYemen, Rep.ZambiaZimbabwe Timeline:
This timeline shows a graph from 1978 to 2016 of Philippines. No data until 1977. Number of actual observations by date: 39.
Source name:
World Development Indicators
Source organization:
International Monetary Fund, Balance of Payments Statistics Yearbook and data files.
Categories, topics:
Economy & Growth
Last updated:
apr 23, 2017
Indicators value changes by year
Minimum:
352.0 mln
jan 1, 1978
Maximum:
9.505 bln
jan 1, 2016
At the date of observation
Value
Absolute change
Change from previous value
jan 1, 1978
352.0 mln
+352.0 mln
0.0%
jan 1, 1979
472.0 mln
+120.0 mln
34.09%
jan 1, 1980
578.0 mln
+106.0 mln
22.46%
jan 1, 1981
762.0 mln
+184.0 mln
31.83%
jan 1, 1982
1.07 bln
+308.0 mln
40.42%
jan 1, 1983
1.179 bln
+109.0 mln
10.19%
jan 1, 1984
1.319 bln
+140.0 mln
11.87%
jan 1, 1985
984.0 mln
-335.0 mln
-25.4%
jan 1, 1986
1.053 bln
+69.0 mln
7.01%
jan 1, 1987
931.0 mln
-122.0 mln
-11.59%
jan 1, 1988
1.109 bln
+178.0 mln
19.12%
jan 1, 1989
1.179 bln
+70.0 mln
6.31%
jan 1, 1990
1.361 bln
+182.0 mln
15.44%
jan 1, 1991
1.598 bln
+237.0 mln
17.41%
jan 1, 1992
1.969 bln
+371.0 mln
23.22%
jan 1, 1993
2.755 bln
+786.0 mln
39.92%
jan 1, 1994
2.824 bln
+69.0 mln
2.5%
jan 1, 1995
3.782 bln
+958.0 mln
33.92%
jan 1, 1996
6.067 bln
+2.285 bln
60.42%
jan 1, 1997
6.059 bln
-8.0 mln
-0.13%
jan 1, 1998
7.698 bln
+1.639 bln
27.05%
jan 1, 1999
6.44 bln
-1.258 bln
-16.34%
jan 1, 2000
2.723 bln
-3.717 bln
-57.72%
jan 1, 2001
3.336 bln
+613.0 mln
22.51%
jan 1, 2002
3.553 bln
+217.0 mln
6.5%
jan 1, 2003
3.306 bln
-247.0 mln
-6.95%
jan 1, 2004
3.33 bln
+24.0 mln
0.73%
jan 1, 2005
3.725 bln
+395.0 mln
11.86%
jan 1, 2006
4.741 bln
+1.016 bln
27.28%
jan 1, 2007
6.076 bln
+1.335 bln
28.15%
jan 1, 2008
7.392 bln
+1.316 bln
21.67%
jan 1, 2009
7.005 bln
-387.861 mln
-5.25%
jan 1, 2010
6.405 bln
-599.679 mln
-8.56%
jan 1, 2011
6.688 bln
+282.688 mln
4.41%
jan 1, 2012
7.637 bln
+949.431 mln
14.2%
jan 1, 2013
8.257 bln
+620.0 mln
8.12%
jan 1, 2014
8.358 bln
+101.314 mln
1.23%
jan 1, 2015
8.779 bln
+420.674 mln
5.03%
jan 1, 2016
9.505 bln
+726.288 mln
8.27%
Ranking of countries by current statistics by years


Comments: