29
/
en
AIzaSyAYiBZKx7MnpbEhh9jyipgxe19OcubqV5w
April 1, 2024
257718
Switzerland
CHE
true
2
1
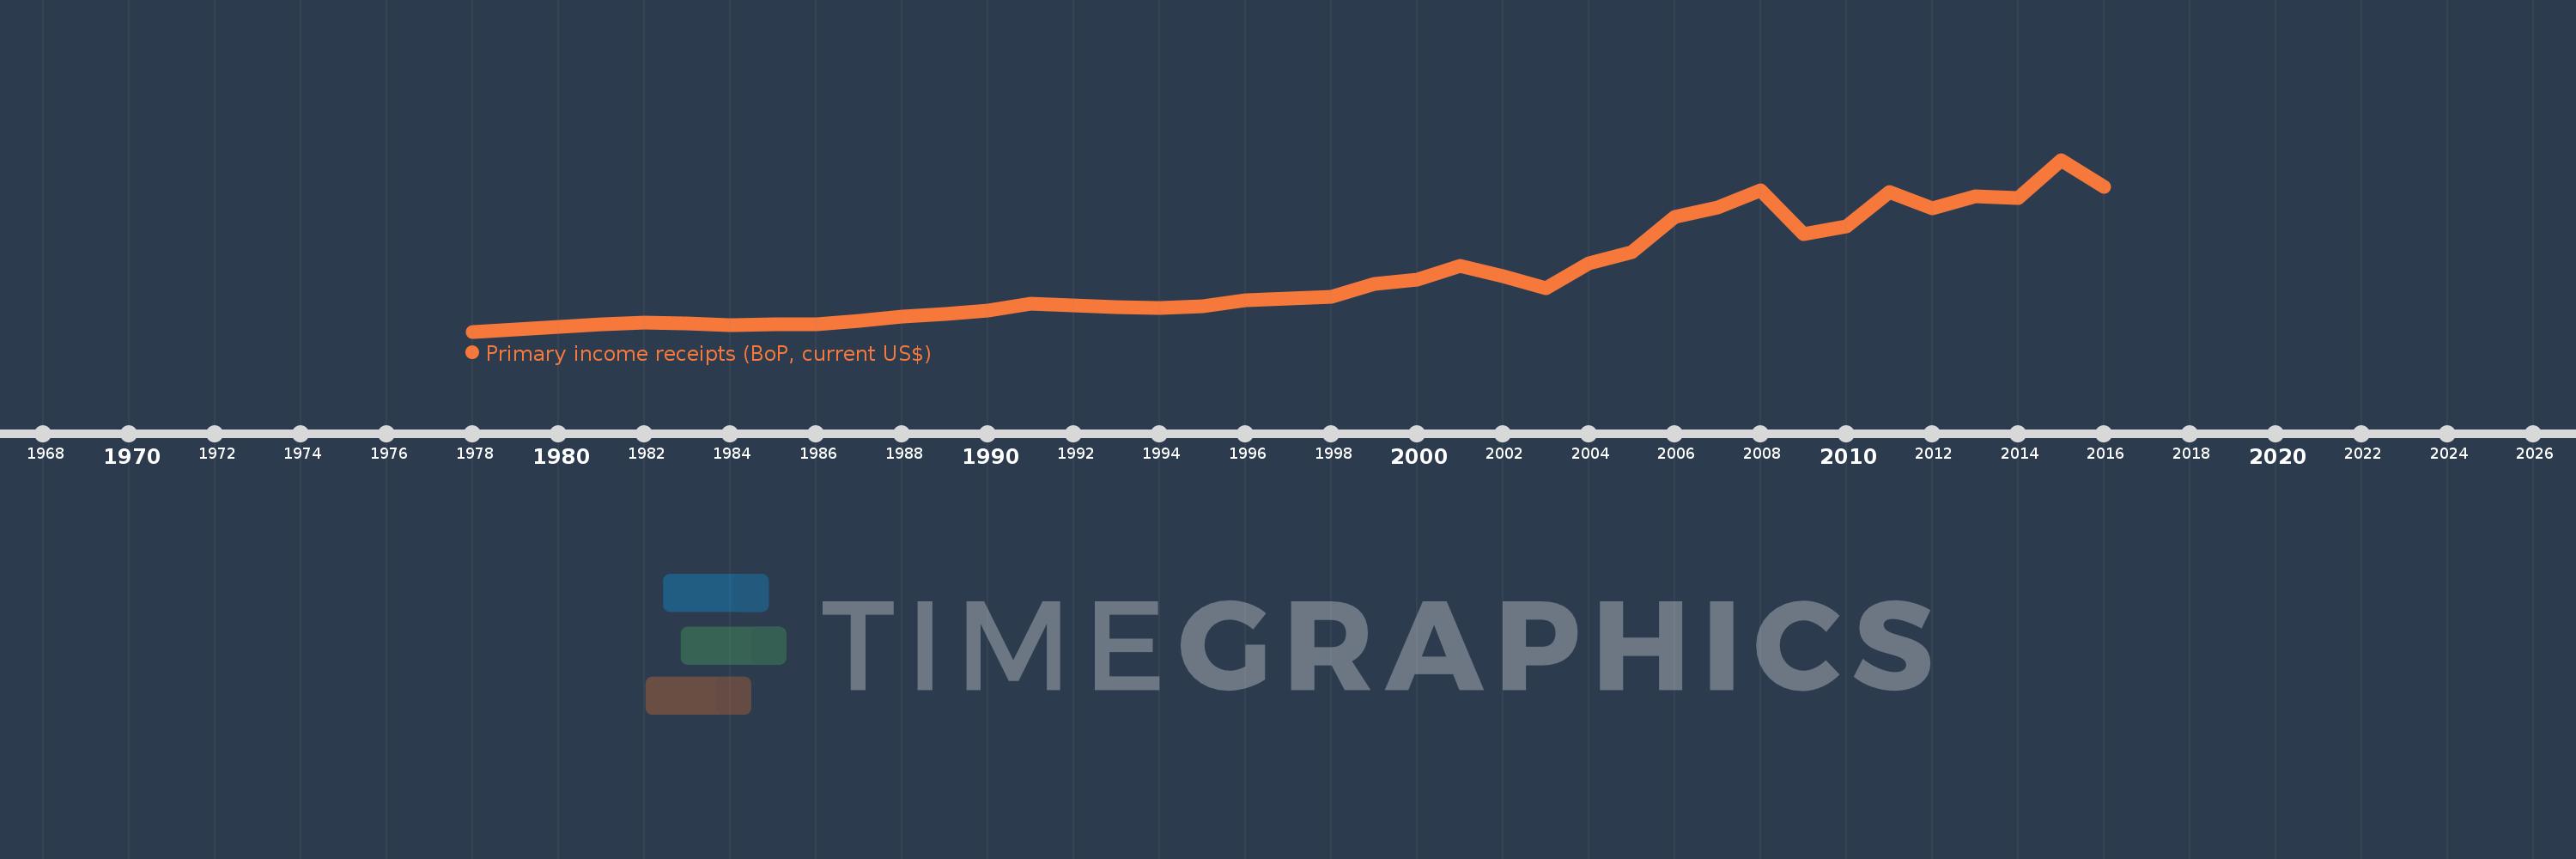
Primary income receipts (BoP, current US$)
2016,2015,2014,2013,2012,2011,2010,2009,2008,2007,2006,2005,2004,2003,2002,2001,2000,1999,1998,1997,1996,1995,1994,1993,1992,1991,1990,1989,1988,1987,1986,1985,1984,1983,1982,1981,1980,1979,1978
This statistics in other country:
AfghanistanAlbaniaAlgeriaAngolaAntigua and BarbudaArab WorldArgentinaArmeniaArubaAustraliaAustriaAzerbaijanBahamas, TheBahrainBangladeshBarbadosBelarusBelgiumBelizeBeninBermudaBhutanBoliviaBosnia and HerzegovinaBotswanaBrazilBrunei DarussalamBulgariaBurkina FasoBurundiCabo VerdeCambodiaCameroonCanadaCaribbean small statesCentral African RepublicCentral Europe and the BalticsChadChileChinaColombiaComorosCongo, Dem. Rep.Congo, Rep.Costa RicaCote d'IvoireCroatiaCuracaoCyprusCzech RepublicDenmarkDjiboutiDominicaDominican RepublicEarly-demographic dividendEast Asia & PacificEast Asia & Pacific (excluding high income)East Asia & Pacific (IDA & IBRD countries)EcuadorEgypt, Arab Rep.El SalvadorEquatorial GuineaEritreaEstoniaEthiopiaEuro areaEurope & Central AsiaEurope & Central Asia (excluding high income)Europe & Central Asia (IDA & IBRD countries)European UnionFaroe IslandsFijiFinlandFragile and conflict affected situationsFranceFrench PolynesiaGabonGambia, TheGeorgiaGermanyGhanaGreeceGrenadaGuatemalaGuineaGuinea-BissauGuyanaHaitiHeavily indebted poor countries (HIPC)High incomeHondurasHong Kong SAR, ChinaHungaryIBRD onlyIcelandIDA & IBRD totalIDA blendIDA onlyIDA totalIndiaIndonesiaIran, Islamic Rep.IraqIrelandIsraelItalyJamaicaJapanJordanKazakhstanKenyaKiribatiKorea, Rep.KosovoKuwaitKyrgyz RepublicLao PDRLate-demographic dividendLatin America & Caribbean Latin America & Caribbean (excluding high income)Latin America & the Caribbean (IDA & IBRD countries)LatviaLeast developed countries: UN classificationLebanonLesothoLiberiaLibyaLithuaniaLow & middle incomeLow incomeLower middle incomeLuxembourgMacao SAR, ChinaMacedonia, FYRMadagascarMalawiMalaysiaMaldivesMaliMaltaMarshall IslandsMauritaniaMauritiusMexicoMicronesia, Fed. Sts.Middle East & North AfricaMiddle East & North Africa (excluding high income)Middle East & North Africa (IDA & IBRD countries)Middle incomeMoldovaMongoliaMontenegroMoroccoMozambiqueMyanmarNamibiaNepalNetherlandsNew CaledoniaNew ZealandNicaraguaNigerNigeriaNorth AmericaNorwayOECD membersOmanOther small statesPacific island small statesPakistanPalauPanamaPapua New GuineaParaguayPeruPhilippinesPolandPortugalPost-demographic dividendPre-demographic dividendQatarRomaniaRussian FederationRwandaSamoaSao Tome and PrincipeSaudi ArabiaSenegalSerbiaSeychellesSierra LeoneSingaporeSint Maarten (Dutch part)Slovak RepublicSloveniaSmall statesSolomon IslandsSouth AfricaSouth AsiaSouth Asia (IDA & IBRD)South SudanSpainSri LankaSt. Kitts and NevisSt. LuciaSt. Vincent and the GrenadinesSub-Saharan Africa Sub-Saharan Africa (excluding high income)Sub-Saharan Africa (IDA & IBRD countries)SudanSurinameSwazilandSwedenSwitzerlandSyrian Arab RepublicTajikistanTanzaniaThailandTimor-LesteTogoTongaTrinidad and TobagoTunisiaTurkeyTuvaluUgandaUkraineUnited KingdomUnited StatesUpper middle incomeUruguayVanuatuVenezuela, RBVietnamWest Bank and GazaWorldYemen, Rep.ZambiaZimbabwe Timeline:
This timeline shows a graph from 1978 to 2016 of Switzerland. No data until 1977. Number of actual observations by date: 39.
Source name:
World Development Indicators
Source organization:
International Monetary Fund, Balance of Payments Statistics Yearbook and data files.
Categories, topics:
Economy & Growth
Last updated:
apr 23, 2017
Indicators value changes by year
Minimum:
4.953 bln
jan 1, 1978
Maximum:
152.242 bln
jan 1, 2015
At the date of observation
Value
Absolute change
Change from previous value
jan 1, 1978
4.953 bln
+4.953 bln
0.0%
jan 1, 1979
7.075 bln
+2.122 bln
42.84%
jan 1, 1980
8.805 bln
+1.73 bln
24.45%
jan 1, 1981
10.867 bln
+2.062 bln
23.42%
jan 1, 1982
12.33 bln
+1.463 bln
13.47%
jan 1, 1983
11.959 bln
-371.487 mln
-3.01%
jan 1, 1984
10.521 bln
-1.438 bln
-12.02%
jan 1, 1985
11.105 bln
+583.457 mln
5.55%
jan 1, 1986
10.906 bln
-199.066 mln
-1.79%
jan 1, 1987
14.013 bln
+3.107 bln
28.49%
jan 1, 1988
17.533 bln
+3.52 bln
25.12%
jan 1, 1989
20.057 bln
+2.524 bln
14.4%
jan 1, 1990
22.697 bln
+2.64 bln
13.16%
jan 1, 1991
28.685 bln
+5.988 bln
26.38%
jan 1, 1992
27.521 bln
-1.165 bln
-4.06%
jan 1, 1993
26.239 bln
-1.282 bln
-4.66%
jan 1, 1994
25.152 bln
-1.086 bln
-4.14%
jan 1, 1995
26.747 bln
+1.595 bln
6.34%
jan 1, 1996
31.575 bln
+4.827 bln
18.05%
jan 1, 1997
32.997 bln
+1.422 bln
4.5%
jan 1, 1998
35.066 bln
+2.069 bln
6.27%
jan 1, 1999
45.926 bln
+10.86 bln
30.97%
jan 1, 2000
49.22 bln
+3.294 bln
7.17%
jan 1, 2001
61.319 bln
+12.1 bln
24.58%
jan 1, 2002
52.642 bln
-8.678 bln
-14.15%
jan 1, 2003
42.017 bln
-10.624 bln
-20.18%
jan 1, 2004
63.591 bln
+21.574 bln
51.34%
jan 1, 2005
72.824 bln
+9.233 bln
14.52%
jan 1, 2006
103.633 bln
+30.809 bln
42.31%
jan 1, 2007
111.265 bln
+7.632 bln
7.36%
jan 1, 2008
126.056 bln
+14.791 bln
13.29%
jan 1, 2009
88.904 bln
-37.151 bln
-29.47%
jan 1, 2010
95.388 bln
+6.484 bln
7.29%
jan 1, 2011
124.953 bln
+29.565 bln
30.99%
jan 1, 2012
110.287 bln
-14.666 bln
-11.74%
jan 1, 2013
120.909 bln
+10.622 bln
9.63%
jan 1, 2014
119.447 bln
-1.463 bln
-1.21%
jan 1, 2015
152.242 bln
+32.796 bln
27.46%
jan 1, 2016
129.068 bln
-23.174 bln
-15.22%
Ranking of countries by current statistics by years


Comments: