29
/
en
AIzaSyAYiBZKx7MnpbEhh9jyipgxe19OcubqV5w
April 1, 2024
163187
Jamaica
JAM
true
2
1
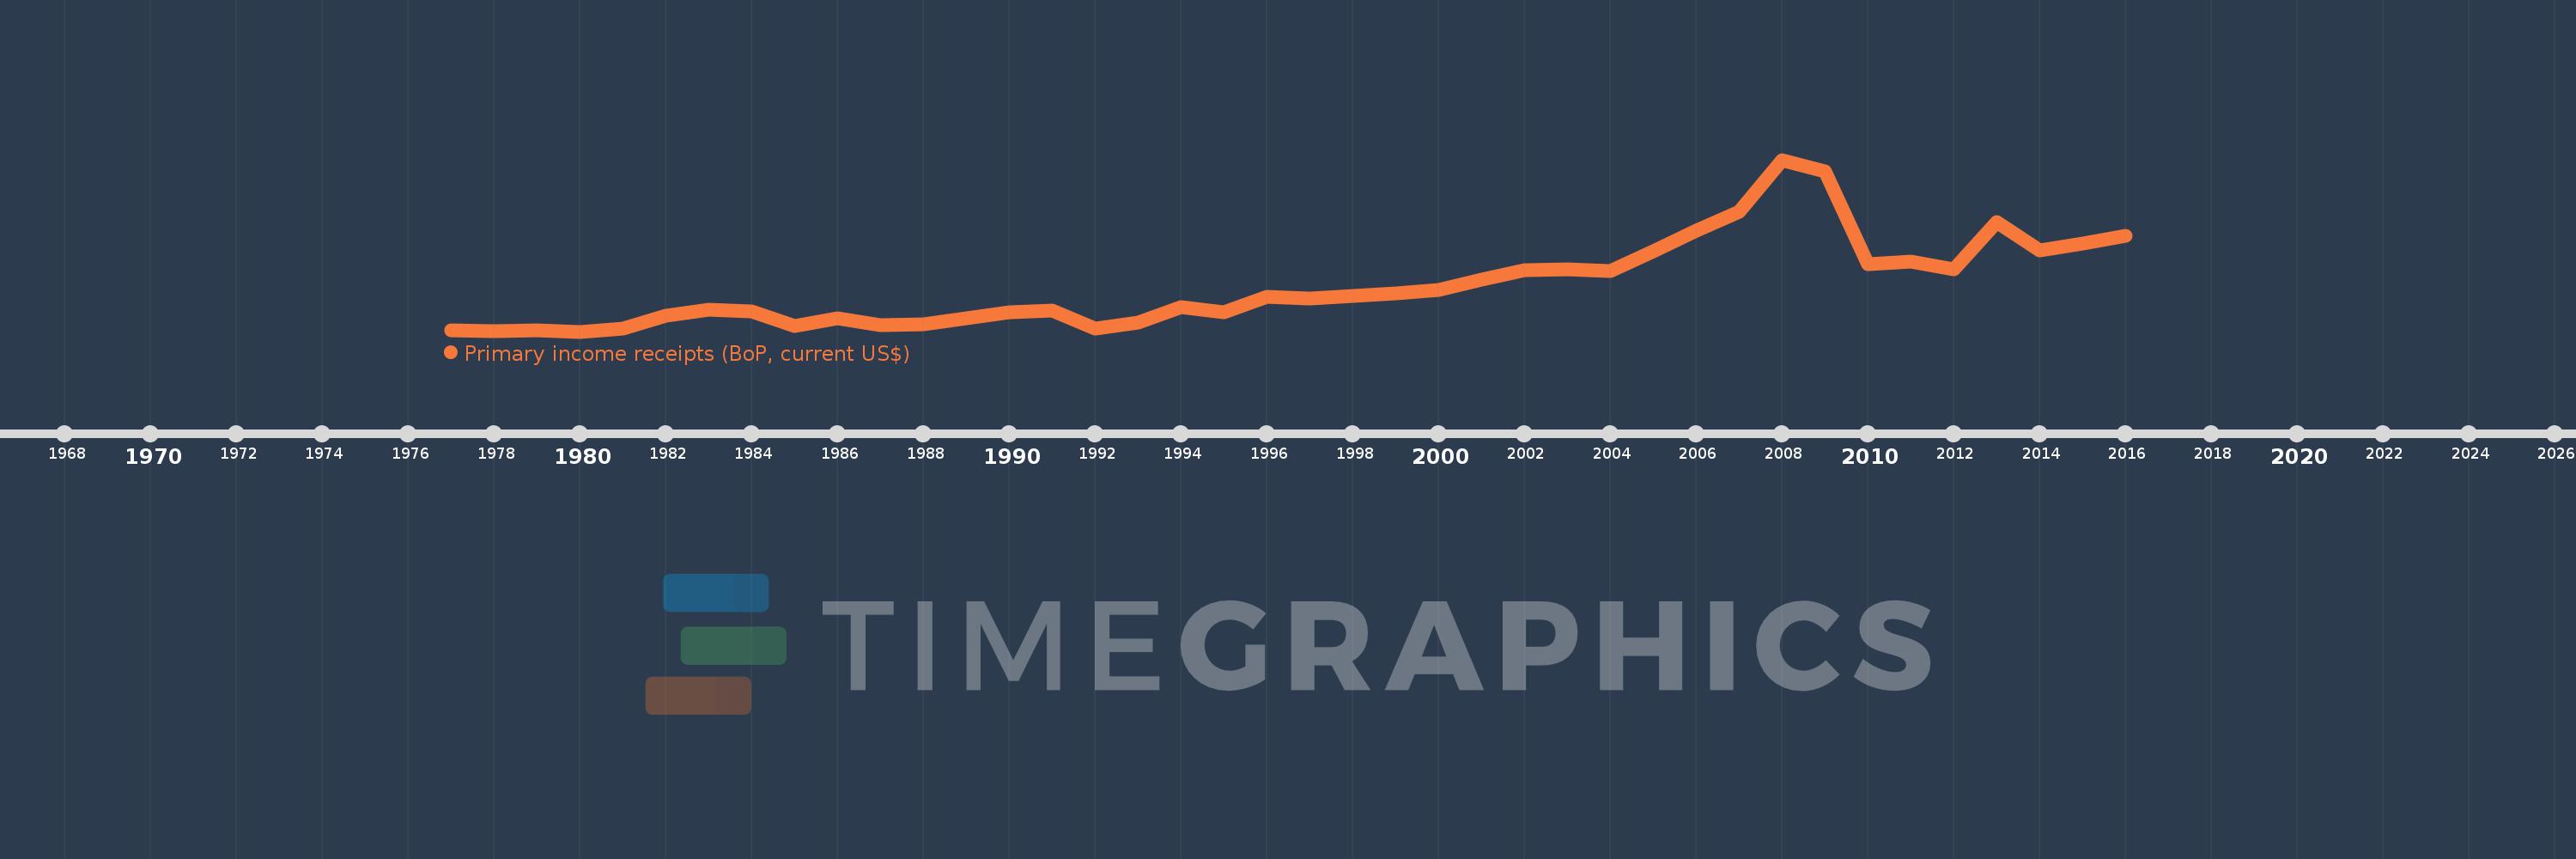
Primary income receipts (BoP, current US$)
2016,2015,2014,2013,2012,2011,2010,2009,2008,2007,2006,2005,2004,2003,2002,2001,2000,1999,1998,1997,1996,1995,1994,1993,1992,1991,1990,1989,1988,1987,1986,1985,1984,1983,1982,1981,1980,1979,1978,1977
This statistics in other country:
AfghanistanAlbaniaAlgeriaAngolaAntigua and BarbudaArab WorldArgentinaArmeniaArubaAustraliaAustriaAzerbaijanBahamas, TheBahrainBangladeshBarbadosBelarusBelgiumBelizeBeninBermudaBhutanBoliviaBosnia and HerzegovinaBotswanaBrazilBrunei DarussalamBulgariaBurkina FasoBurundiCabo VerdeCambodiaCameroonCanadaCaribbean small statesCentral African RepublicCentral Europe and the BalticsChadChileChinaColombiaComorosCongo, Dem. Rep.Congo, Rep.Costa RicaCote d'IvoireCroatiaCuracaoCyprusCzech RepublicDenmarkDjiboutiDominicaDominican RepublicEarly-demographic dividendEast Asia & PacificEast Asia & Pacific (excluding high income)East Asia & Pacific (IDA & IBRD countries)EcuadorEgypt, Arab Rep.El SalvadorEquatorial GuineaEritreaEstoniaEthiopiaEuro areaEurope & Central AsiaEurope & Central Asia (excluding high income)Europe & Central Asia (IDA & IBRD countries)European UnionFaroe IslandsFijiFinlandFragile and conflict affected situationsFranceFrench PolynesiaGabonGambia, TheGeorgiaGermanyGhanaGreeceGrenadaGuatemalaGuineaGuinea-BissauGuyanaHaitiHeavily indebted poor countries (HIPC)High incomeHondurasHong Kong SAR, ChinaHungaryIBRD onlyIcelandIDA & IBRD totalIDA blendIDA onlyIDA totalIndiaIndonesiaIran, Islamic Rep.IraqIrelandIsraelItalyJamaicaJapanJordanKazakhstanKenyaKiribatiKorea, Rep.KosovoKuwaitKyrgyz RepublicLao PDRLate-demographic dividendLatin America & Caribbean Latin America & Caribbean (excluding high income)Latin America & the Caribbean (IDA & IBRD countries)LatviaLeast developed countries: UN classificationLebanonLesothoLiberiaLibyaLithuaniaLow & middle incomeLow incomeLower middle incomeLuxembourgMacao SAR, ChinaMacedonia, FYRMadagascarMalawiMalaysiaMaldivesMaliMaltaMarshall IslandsMauritaniaMauritiusMexicoMicronesia, Fed. Sts.Middle East & North AfricaMiddle East & North Africa (excluding high income)Middle East & North Africa (IDA & IBRD countries)Middle incomeMoldovaMongoliaMontenegroMoroccoMozambiqueMyanmarNamibiaNepalNetherlandsNew CaledoniaNew ZealandNicaraguaNigerNigeriaNorth AmericaNorwayOECD membersOmanOther small statesPacific island small statesPakistanPalauPanamaPapua New GuineaParaguayPeruPhilippinesPolandPortugalPost-demographic dividendPre-demographic dividendQatarRomaniaRussian FederationRwandaSamoaSao Tome and PrincipeSaudi ArabiaSenegalSerbiaSeychellesSierra LeoneSingaporeSint Maarten (Dutch part)Slovak RepublicSloveniaSmall statesSolomon IslandsSouth AfricaSouth AsiaSouth Asia (IDA & IBRD)South SudanSpainSri LankaSt. Kitts and NevisSt. LuciaSt. Vincent and the GrenadinesSub-Saharan Africa Sub-Saharan Africa (excluding high income)Sub-Saharan Africa (IDA & IBRD countries)SudanSurinameSwazilandSwedenSwitzerlandSyrian Arab RepublicTajikistanTanzaniaThailandTimor-LesteTogoTongaTrinidad and TobagoTunisiaTurkeyTuvaluUgandaUkraineUnited KingdomUnited StatesUpper middle incomeUruguayVanuatuVenezuela, RBVietnamWest Bank and GazaWorldYemen, Rep.ZambiaZimbabwe Timeline:
This timeline shows a graph from 1977 to 2016 of Jamaica. No data until 1976. Number of actual observations by date: 40.
Source name:
World Development Indicators
Source organization:
International Monetary Fund, Balance of Payments Statistics Yearbook and data files.
Categories, topics:
Economy & Growth
Last updated:
apr 23, 2017
Indicators value changes by year
Minimum:
50.9 mln
jan 1, 1980
Maximum:
520.735 mln
jan 1, 2008
At the date of observation
Value
Absolute change
Change from previous value
jan 1, 1977
53.8 mln
+53.8 mln
0.0%
jan 1, 1978
52.0 mln
-1.8 mln
-3.35%
jan 1, 1979
53.3 mln
+1.3 mln
2.5%
jan 1, 1980
50.9 mln
-2.4 mln
-4.5%
jan 1, 1981
58.2 mln
+7.3 mln
14.34%
jan 1, 1982
94.9 mln
+36.7 mln
63.06%
jan 1, 1983
110.7 mln
+15.8 mln
16.65%
jan 1, 1984
106.4 mln
-4.3 mln
-3.88%
jan 1, 1985
66.6 mln
-39.8 mln
-37.41%
jan 1, 1986
88.1 mln
+21.5 mln
32.28%
jan 1, 1987
68.0 mln
-20.1 mln
-22.81%
jan 1, 1988
71.5 mln
+3.5 mln
5.15%
jan 1, 1989
88.0 mln
+16.5 mln
23.08%
jan 1, 1990
104.0 mln
+16.0 mln
18.18%
jan 1, 1991
107.6 mln
+3.6 mln
3.46%
jan 1, 1992
59.7 mln
-47.9 mln
-44.52%
jan 1, 1993
75.0 mln
+15.3 mln
25.63%
jan 1, 1994
117.0 mln
+42.0 mln
56.0%
jan 1, 1995
104.6 mln
-12.4 mln
-10.6%
jan 1, 1996
146.6 mln
+42.0 mln
40.15%
jan 1, 1997
141.8 mln
-4.8 mln
-3.27%
jan 1, 1998
147.3 mln
+5.5 mln
3.88%
jan 1, 1999
156.3 mln
+9.0 mln
6.11%
jan 1, 2000
165.8 mln
+9.5 mln
6.08%
jan 1, 2001
193.1 mln
+27.3 mln
16.47%
jan 1, 2002
218.2 mln
+25.1 mln
13.0%
jan 1, 2003
221.0 mln
+2.8 mln
1.28%
jan 1, 2004
217.6 mln
-3.4 mln
-1.54%
jan 1, 2005
269.557 mln
+51.957 mln
23.88%
jan 1, 2006
327.929 mln
+58.372 mln
21.65%
jan 1, 2007
378.395 mln
+50.467 mln
15.39%
jan 1, 2008
520.735 mln
+142.34 mln
37.62%
jan 1, 2009
487.945 mln
-32.79 mln
-6.3%
jan 1, 2010
234.966 mln
-252.979 mln
-51.85%
jan 1, 2011
243.202 mln
+8.235 mln
3.5%
jan 1, 2012
221.483 mln
-21.718 mln
-8.93%
jan 1, 2013
350.399 mln
+128.916 mln
58.21%
jan 1, 2014
272.665 mln
-77.734 mln
-22.18%
jan 1, 2015
291.112 mln
+18.447 mln
6.77%
jan 1, 2016
312.275 mln
+21.163 mln
7.27%
Ranking of countries by current statistics by years


Comments: