29
/
en
AIzaSyAYiBZKx7MnpbEhh9jyipgxe19OcubqV5w
April 1, 2024
256750
Sweden
SWE
true
2
1
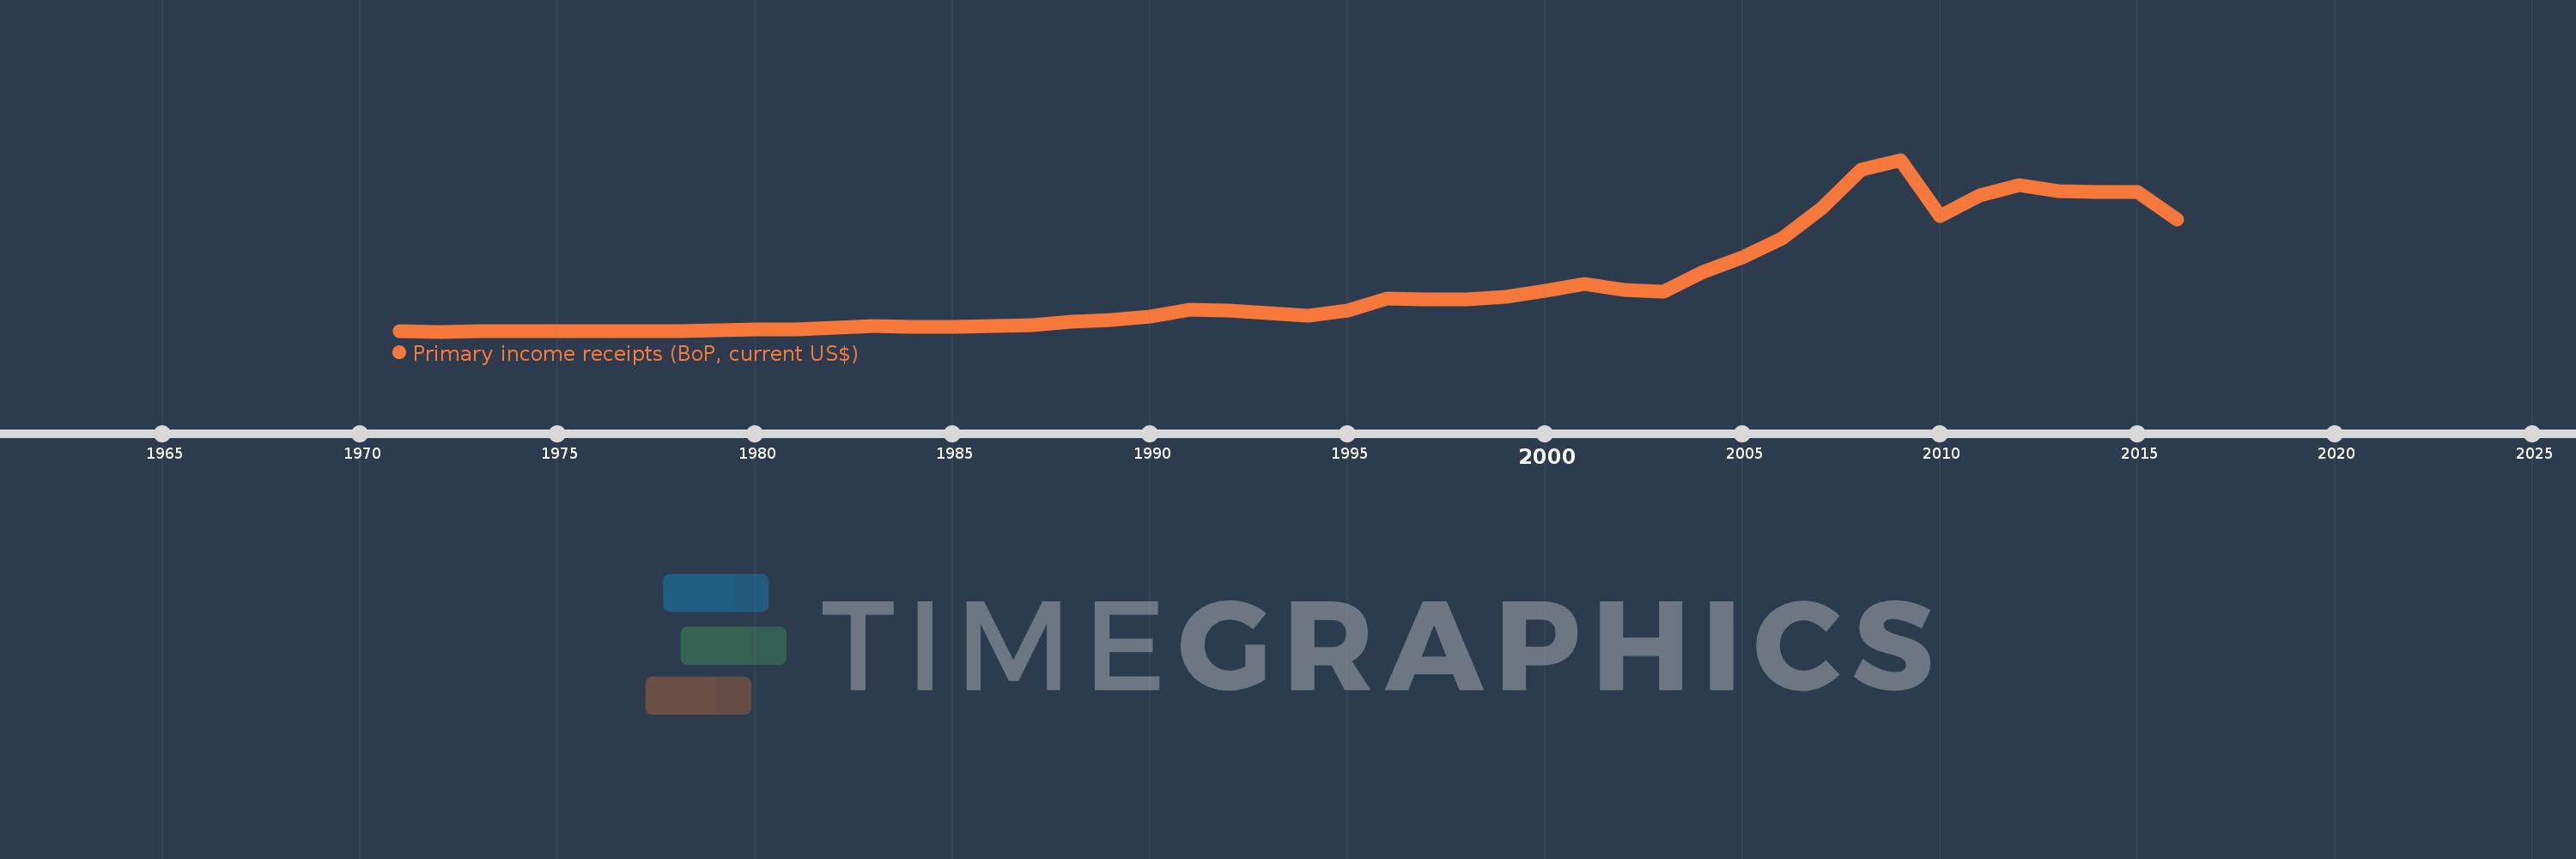
Primary income receipts (BoP, current US$)
2016,2015,2014,2013,2012,2011,2010,2009,2008,2007,2006,2005,2004,2003,2002,2001,2000,1999,1998,1997,1996,1995,1994,1993,1992,1991,1990,1989,1988,1987,1986,1985,1984,1983,1982,1981,1980,1979,1978,1977,1976,1975,1974,1973,1972,1971
This statistics in other country:
AfghanistanAlbaniaAlgeriaAngolaAntigua and BarbudaArab WorldArgentinaArmeniaArubaAustraliaAustriaAzerbaijanBahamas, TheBahrainBangladeshBarbadosBelarusBelgiumBelizeBeninBermudaBhutanBoliviaBosnia and HerzegovinaBotswanaBrazilBrunei DarussalamBulgariaBurkina FasoBurundiCabo VerdeCambodiaCameroonCanadaCaribbean small statesCentral African RepublicCentral Europe and the BalticsChadChileChinaColombiaComorosCongo, Dem. Rep.Congo, Rep.Costa RicaCote d'IvoireCroatiaCuracaoCyprusCzech RepublicDenmarkDjiboutiDominicaDominican RepublicEarly-demographic dividendEast Asia & PacificEast Asia & Pacific (excluding high income)East Asia & Pacific (IDA & IBRD countries)EcuadorEgypt, Arab Rep.El SalvadorEquatorial GuineaEritreaEstoniaEthiopiaEuro areaEurope & Central AsiaEurope & Central Asia (excluding high income)Europe & Central Asia (IDA & IBRD countries)European UnionFaroe IslandsFijiFinlandFragile and conflict affected situationsFranceFrench PolynesiaGabonGambia, TheGeorgiaGermanyGhanaGreeceGrenadaGuatemalaGuineaGuinea-BissauGuyanaHaitiHeavily indebted poor countries (HIPC)High incomeHondurasHong Kong SAR, ChinaHungaryIBRD onlyIcelandIDA & IBRD totalIDA blendIDA onlyIDA totalIndiaIndonesiaIran, Islamic Rep.IraqIrelandIsraelItalyJamaicaJapanJordanKazakhstanKenyaKiribatiKorea, Rep.KosovoKuwaitKyrgyz RepublicLao PDRLate-demographic dividendLatin America & Caribbean Latin America & Caribbean (excluding high income)Latin America & the Caribbean (IDA & IBRD countries)LatviaLeast developed countries: UN classificationLebanonLesothoLiberiaLibyaLithuaniaLow & middle incomeLow incomeLower middle incomeLuxembourgMacao SAR, ChinaMacedonia, FYRMadagascarMalawiMalaysiaMaldivesMaliMaltaMarshall IslandsMauritaniaMauritiusMexicoMicronesia, Fed. Sts.Middle East & North AfricaMiddle East & North Africa (excluding high income)Middle East & North Africa (IDA & IBRD countries)Middle incomeMoldovaMongoliaMontenegroMoroccoMozambiqueMyanmarNamibiaNepalNetherlandsNew CaledoniaNew ZealandNicaraguaNigerNigeriaNorth AmericaNorwayOECD membersOmanOther small statesPacific island small statesPakistanPalauPanamaPapua New GuineaParaguayPeruPhilippinesPolandPortugalPost-demographic dividendPre-demographic dividendQatarRomaniaRussian FederationRwandaSamoaSao Tome and PrincipeSaudi ArabiaSenegalSerbiaSeychellesSierra LeoneSingaporeSint Maarten (Dutch part)Slovak RepublicSloveniaSmall statesSolomon IslandsSouth AfricaSouth AsiaSouth Asia (IDA & IBRD)South SudanSpainSri LankaSt. Kitts and NevisSt. LuciaSt. Vincent and the GrenadinesSub-Saharan Africa Sub-Saharan Africa (excluding high income)Sub-Saharan Africa (IDA & IBRD countries)SudanSurinameSwazilandSwedenSwitzerlandSyrian Arab RepublicTajikistanTanzaniaThailandTimor-LesteTogoTongaTrinidad and TobagoTunisiaTurkeyTuvaluUgandaUkraineUnited KingdomUnited StatesUpper middle incomeUruguayVanuatuVenezuela, RBVietnamWest Bank and GazaWorldYemen, Rep.ZambiaZimbabwe Timeline:
This timeline shows a graph from 1971 to 2016 of Sweden. No data until 1970. Number of actual observations by date: 46.
Source name:
World Development Indicators
Source organization:
International Monetary Fund, Balance of Payments Statistics Yearbook and data files.
Categories, topics:
Economy & Growth
Last updated:
apr 23, 2017
Indicators value changes by year
Minimum:
132.659 mln
jan 1, 1972
Maximum:
76.264 bln
jan 1, 2009
At the date of observation
Value
Absolute change
Change from previous value
jan 1, 1971
152.71 mln
+152.71 mln
0.0%
jan 1, 1972
132.659 mln
-20.05 mln
-13.13%
jan 1, 1973
153.284 mln
+20.624 mln
15.55%
jan 1, 1974
261.034 mln
+107.75 mln
70.29%
jan 1, 1975
306.346 mln
+45.312 mln
17.36%
jan 1, 1976
350.936 mln
+44.59 mln
14.56%
jan 1, 1977
492.406 mln
+141.469 mln
40.31%
jan 1, 1978
510.936 mln
+18.531 mln
3.76%
jan 1, 1979
830.908 mln
+319.972 mln
62.62%
jan 1, 1980
1.008 bln
+176.662 mln
21.26%
jan 1, 1981
1.238 bln
+230.139 mln
22.84%
jan 1, 1982
1.682 bln
+444.011 mln
35.87%
jan 1, 1983
2.431 bln
+749.319 mln
44.56%
jan 1, 1984
2.125 bln
-306.096 mln
-12.59%
jan 1, 1985
2.312 bln
+187.065 mln
8.8%
jan 1, 1986
2.584 bln
+271.87 mln
11.76%
jan 1, 1987
3.142 bln
+558.327 mln
21.61%
jan 1, 1988
4.372 bln
+1.23 bln
39.13%
jan 1, 1989
5.277 bln
+905.006 mln
20.7%
jan 1, 1990
6.968 bln
+1.691 bln
32.05%
jan 1, 1991
9.691 bln
+2.723 bln
39.07%
jan 1, 1992
9.435 bln
-255.76 mln
-2.64%
jan 1, 1993
8.142 bln
-1.293 bln
-13.7%
jan 1, 1994
7.127 bln
-1.015 bln
-12.47%
jan 1, 1995
9.611 bln
+2.484 bln
34.86%
jan 1, 1996
14.906 bln
+5.294 bln
55.08%
jan 1, 1997
14.338 bln
-567.572 mln
-3.81%
jan 1, 1998
14.404 bln
+65.655 mln
0.46%
jan 1, 1999
15.601 bln
+1.198 bln
8.31%
jan 1, 2000
18.025 bln
+2.424 bln
15.53%
jan 1, 2001
21.198 bln
+3.173 bln
17.61%
jan 1, 2002
18.729 bln
-2.469 bln
-11.65%
jan 1, 2003
17.803 bln
-925.913 mln
-4.94%
jan 1, 2004
26.721 bln
+8.918 bln
50.09%
jan 1, 2005
32.882 bln
+6.161 bln
23.06%
jan 1, 2006
41.275 bln
+8.393 bln
25.52%
jan 1, 2007
54.91 bln
+13.635 bln
33.03%
jan 1, 2008
71.79 bln
+16.88 bln
30.74%
jan 1, 2009
76.264 bln
+4.474 bln
6.23%
jan 1, 2010
51.211 bln
-25.052 bln
-32.85%
jan 1, 2011
60.305 bln
+9.094 bln
17.76%
jan 1, 2012
65.098 bln
+4.792 bln
7.95%
jan 1, 2013
62.214 bln
-2.884 bln
-4.43%
jan 1, 2014
61.804 bln
-410.014 mln
-0.66%
jan 1, 2015
61.867 bln
+63.667 mln
0.1%
jan 1, 2016
49.815 bln
-12.053 bln
-19.48%
Ranking of countries by current statistics by years


Comments: