29
/
en
AIzaSyAYiBZKx7MnpbEhh9jyipgxe19OcubqV5w
April 1, 2024
111541
Congo, Rep.
COG
true
2
1
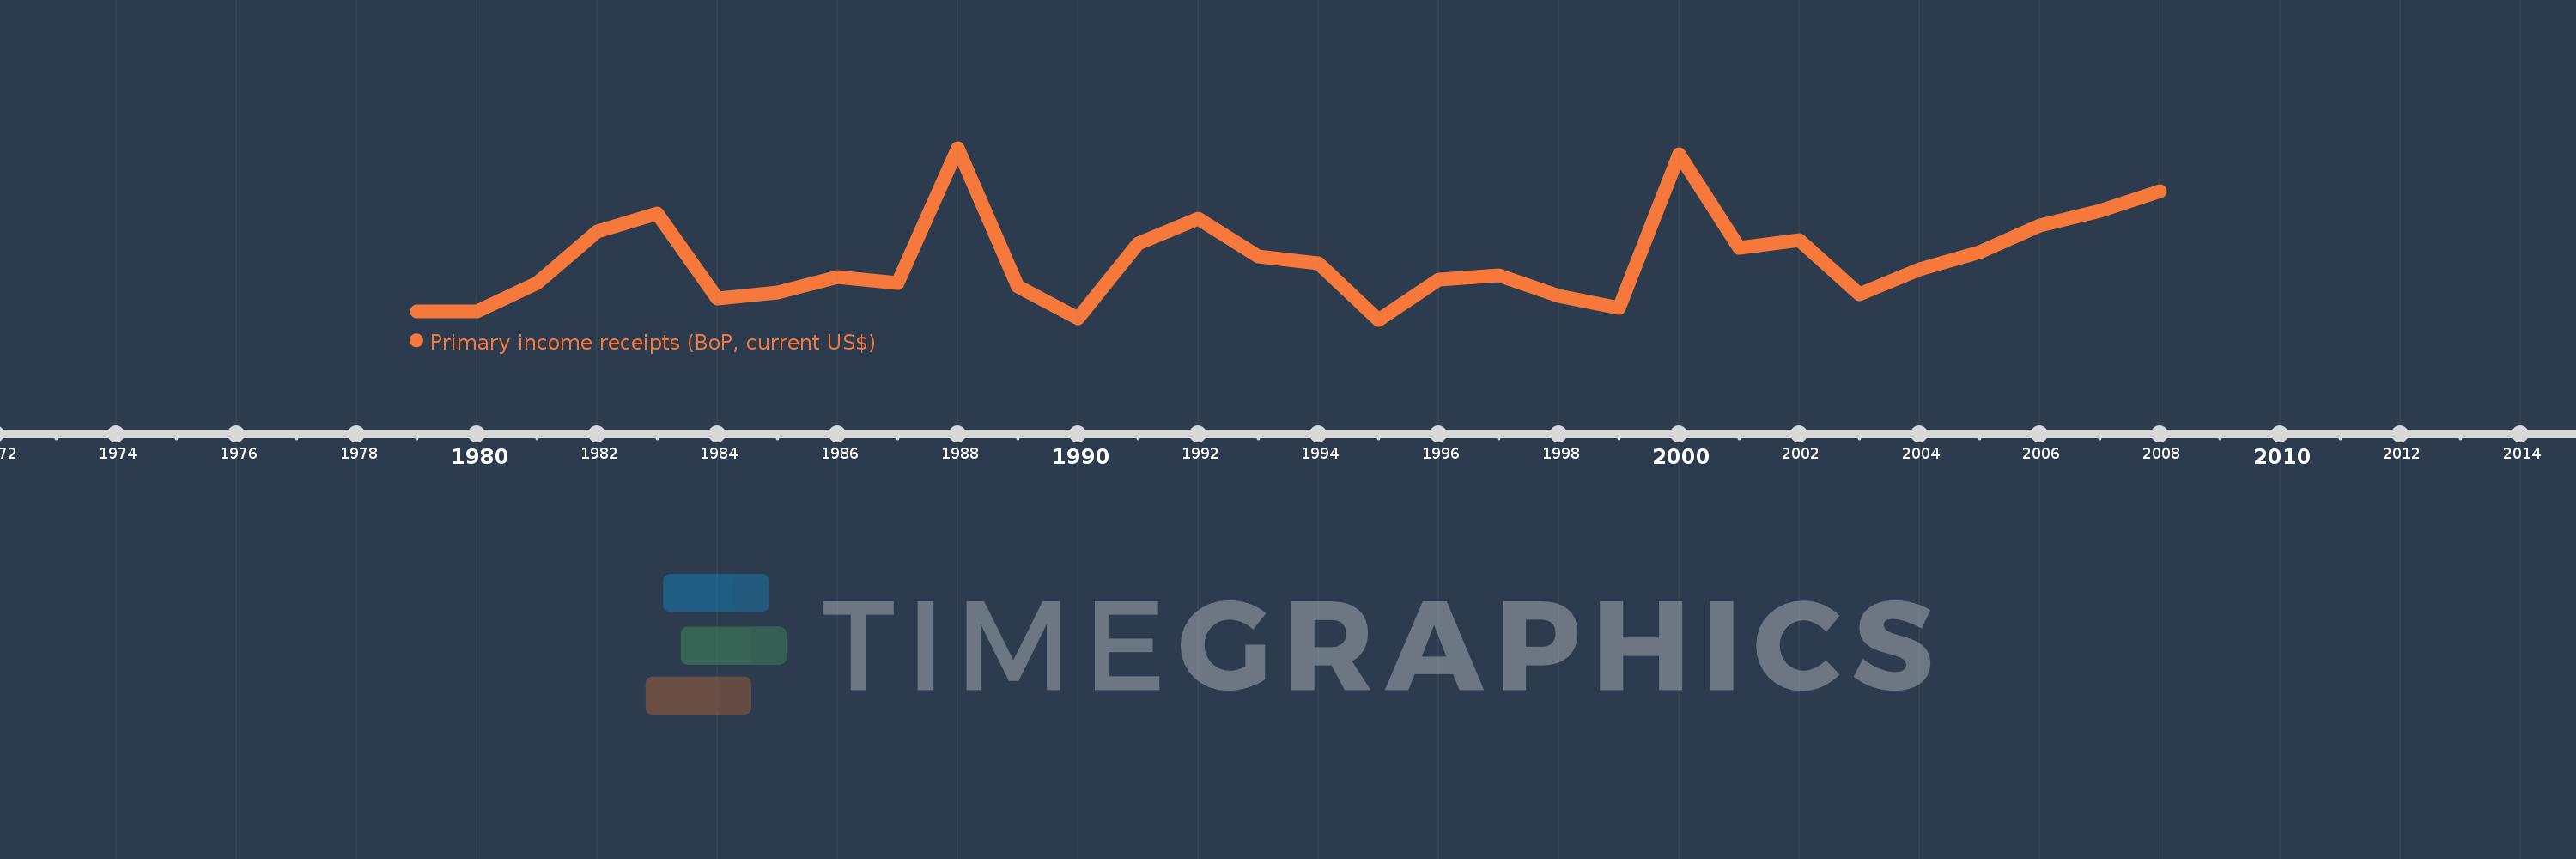
Primary income receipts (BoP, current US$)
2008,2007,2006,2005,2004,2003,2002,2001,2000,1999,1998,1997,1996,1995,1994,1993,1992,1991,1990,1989,1988,1987,1986,1985,1984,1983,1982,1981,1980,1979
This statistics in other country:
AfghanistanAlbaniaAlgeriaAngolaAntigua and BarbudaArab WorldArgentinaArmeniaArubaAustraliaAustriaAzerbaijanBahamas, TheBahrainBangladeshBarbadosBelarusBelgiumBelizeBeninBermudaBhutanBoliviaBosnia and HerzegovinaBotswanaBrazilBrunei DarussalamBulgariaBurkina FasoBurundiCabo VerdeCambodiaCameroonCanadaCaribbean small statesCentral African RepublicCentral Europe and the BalticsChadChileChinaColombiaComorosCongo, Dem. Rep.Congo, Rep.Costa RicaCote d'IvoireCroatiaCuracaoCyprusCzech RepublicDenmarkDjiboutiDominicaDominican RepublicEarly-demographic dividendEast Asia & PacificEast Asia & Pacific (excluding high income)East Asia & Pacific (IDA & IBRD countries)EcuadorEgypt, Arab Rep.El SalvadorEquatorial GuineaEritreaEstoniaEthiopiaEuro areaEurope & Central AsiaEurope & Central Asia (excluding high income)Europe & Central Asia (IDA & IBRD countries)European UnionFaroe IslandsFijiFinlandFragile and conflict affected situationsFranceFrench PolynesiaGabonGambia, TheGeorgiaGermanyGhanaGreeceGrenadaGuatemalaGuineaGuinea-BissauGuyanaHaitiHeavily indebted poor countries (HIPC)High incomeHondurasHong Kong SAR, ChinaHungaryIBRD onlyIcelandIDA & IBRD totalIDA blendIDA onlyIDA totalIndiaIndonesiaIran, Islamic Rep.IraqIrelandIsraelItalyJamaicaJapanJordanKazakhstanKenyaKiribatiKorea, Rep.KosovoKuwaitKyrgyz RepublicLao PDRLate-demographic dividendLatin America & Caribbean Latin America & Caribbean (excluding high income)Latin America & the Caribbean (IDA & IBRD countries)LatviaLeast developed countries: UN classificationLebanonLesothoLiberiaLibyaLithuaniaLow & middle incomeLow incomeLower middle incomeLuxembourgMacao SAR, ChinaMacedonia, FYRMadagascarMalawiMalaysiaMaldivesMaliMaltaMarshall IslandsMauritaniaMauritiusMexicoMicronesia, Fed. Sts.Middle East & North AfricaMiddle East & North Africa (excluding high income)Middle East & North Africa (IDA & IBRD countries)Middle incomeMoldovaMongoliaMontenegroMoroccoMozambiqueMyanmarNamibiaNepalNetherlandsNew CaledoniaNew ZealandNicaraguaNigerNigeriaNorth AmericaNorwayOECD membersOmanOther small statesPacific island small statesPakistanPalauPanamaPapua New GuineaParaguayPeruPhilippinesPolandPortugalPost-demographic dividendPre-demographic dividendQatarRomaniaRussian FederationRwandaSamoaSao Tome and PrincipeSaudi ArabiaSenegalSerbiaSeychellesSierra LeoneSingaporeSint Maarten (Dutch part)Slovak RepublicSloveniaSmall statesSolomon IslandsSouth AfricaSouth AsiaSouth Asia (IDA & IBRD)South SudanSpainSri LankaSt. Kitts and NevisSt. LuciaSt. Vincent and the GrenadinesSub-Saharan Africa Sub-Saharan Africa (excluding high income)Sub-Saharan Africa (IDA & IBRD countries)SudanSurinameSwazilandSwedenSwitzerlandSyrian Arab RepublicTajikistanTanzaniaThailandTimor-LesteTogoTongaTrinidad and TobagoTunisiaTurkeyTuvaluUgandaUkraineUnited KingdomUnited StatesUpper middle incomeUruguayVanuatuVenezuela, RBVietnamWest Bank and GazaWorldYemen, Rep.ZambiaZimbabwe Timeline:
This timeline shows a graph from 1979 to 2008 of Congo, Rep.. No data until 1978. Number of actual observations by date: 30.
Source name:
World Development Indicators
Source organization:
International Monetary Fund, Balance of Payments Statistics Yearbook and data files.
Categories, topics:
Economy & Growth
Last updated:
apr 23, 2017
Indicators value changes by year
Minimum:
1.981 mln
jan 1, 1995
Maximum:
30.532 mln
jan 1, 1988
At the date of observation
Value
Absolute change
Change from previous value
jan 1, 1979
3.412 mln
+3.412 mln
0.0%
jan 1, 1980
3.309 mln
-102.786K
-3.01%
jan 1, 1981
8.023 mln
+4.713 mln
142.41%
jan 1, 1982
16.601 mln
+8.578 mln
106.93%
jan 1, 1983
19.634 mln
+3.033 mln
18.27%
jan 1, 1984
5.445 mln
-14.189 mln
-72.27%
jan 1, 1985
6.538 mln
+1.093 mln
20.08%
jan 1, 1986
9.133 mln
+2.594 mln
39.68%
jan 1, 1987
8.074 mln
-1.059 mln
-11.6%
jan 1, 1988
30.532 mln
+22.458 mln
278.16%
jan 1, 1989
7.47 mln
-23.062 mln
-75.53%
jan 1, 1990
2.194 mln
-5.276 mln
-70.63%
jan 1, 1991
14.692 mln
+12.497 mln
569.53%
jan 1, 1992
18.787 mln
+4.096 mln
27.88%
jan 1, 1993
12.467 mln
-6.32 mln
-33.64%
jan 1, 1994
11.301 mln
-1.166 mln
-9.36%
jan 1, 1995
1.981 mln
-9.32 mln
-82.47%
jan 1, 1996
8.627 mln
+6.645 mln
335.42%
jan 1, 1997
9.291 mln
+664.633K
7.7%
jan 1, 1998
5.925 mln
-3.367 mln
-36.24%
jan 1, 1999
3.992 mln
-1.933 mln
-32.62%
jan 1, 2000
29.557 mln
+25.565 mln
640.42%
jan 1, 2001
13.974 mln
-15.583 mln
-52.72%
jan 1, 2002
15.234 mln
+1.26 mln
9.02%
jan 1, 2003
6.169 mln
-9.064 mln
-59.5%
jan 1, 2004
10.323 mln
+4.154 mln
67.33%
jan 1, 2005
13.25 mln
+2.927 mln
28.35%
jan 1, 2006
17.631 mln
+4.381 mln
33.06%
jan 1, 2007
20.081 mln
+2.449 mln
13.89%
jan 1, 2008
23.369 mln
+3.288 mln
16.38%
Ranking of countries by current statistics by years


Comments: