29
/
en
AIzaSyAYiBZKx7MnpbEhh9jyipgxe19OcubqV5w
April 1, 2024
36938
IBRD only
IBD
false
2
1
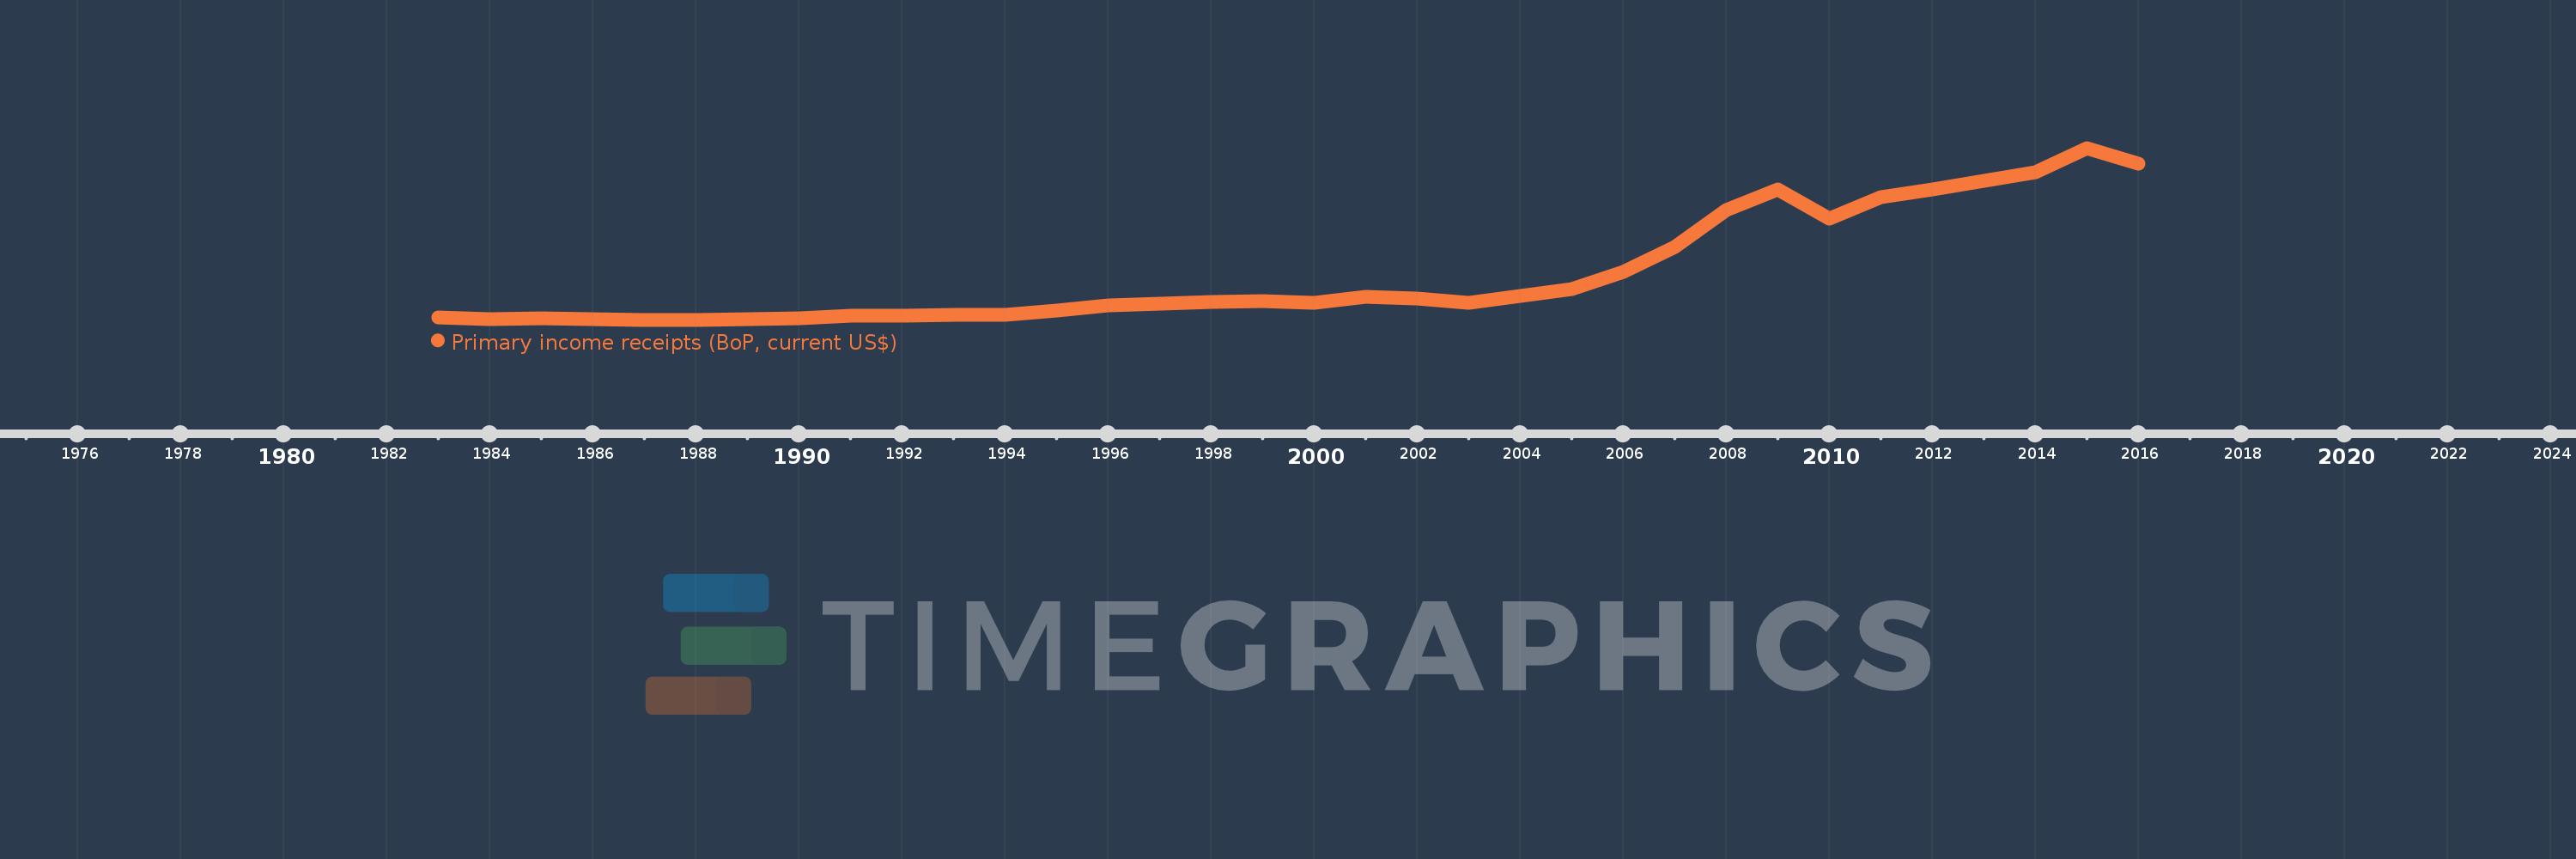
Primary income receipts (BoP, current US$)
2016,2015,2014,2013,2012,2011,2010,2009,2008,2007,2006,2005,2004,2003,2002,2001,2000,1999,1998,1997,1996,1995,1994,1993,1992,1991,1990,1989,1988,1987,1986,1985,1984,1983
This statistics in other country:
AfghanistanAlbaniaAlgeriaAngolaAntigua and BarbudaArab WorldArgentinaArmeniaArubaAustraliaAustriaAzerbaijanBahamas, TheBahrainBangladeshBarbadosBelarusBelgiumBelizeBeninBermudaBhutanBoliviaBosnia and HerzegovinaBotswanaBrazilBrunei DarussalamBulgariaBurkina FasoBurundiCabo VerdeCambodiaCameroonCanadaCaribbean small statesCentral African RepublicCentral Europe and the BalticsChadChileChinaColombiaComorosCongo, Dem. Rep.Congo, Rep.Costa RicaCote d'IvoireCroatiaCuracaoCyprusCzech RepublicDenmarkDjiboutiDominicaDominican RepublicEarly-demographic dividendEast Asia & PacificEast Asia & Pacific (excluding high income)East Asia & Pacific (IDA & IBRD countries)EcuadorEgypt, Arab Rep.El SalvadorEquatorial GuineaEritreaEstoniaEthiopiaEuro areaEurope & Central AsiaEurope & Central Asia (excluding high income)Europe & Central Asia (IDA & IBRD countries)European UnionFaroe IslandsFijiFinlandFragile and conflict affected situationsFranceFrench PolynesiaGabonGambia, TheGeorgiaGermanyGhanaGreeceGrenadaGuatemalaGuineaGuinea-BissauGuyanaHaitiHeavily indebted poor countries (HIPC)High incomeHondurasHong Kong SAR, ChinaHungaryIBRD onlyIcelandIDA & IBRD totalIDA blendIDA onlyIDA totalIndiaIndonesiaIran, Islamic Rep.IraqIrelandIsraelItalyJamaicaJapanJordanKazakhstanKenyaKiribatiKorea, Rep.KosovoKuwaitKyrgyz RepublicLao PDRLate-demographic dividendLatin America & Caribbean Latin America & Caribbean (excluding high income)Latin America & the Caribbean (IDA & IBRD countries)LatviaLeast developed countries: UN classificationLebanonLesothoLiberiaLibyaLithuaniaLow & middle incomeLow incomeLower middle incomeLuxembourgMacao SAR, ChinaMacedonia, FYRMadagascarMalawiMalaysiaMaldivesMaliMaltaMarshall IslandsMauritaniaMauritiusMexicoMicronesia, Fed. Sts.Middle East & North AfricaMiddle East & North Africa (excluding high income)Middle East & North Africa (IDA & IBRD countries)Middle incomeMoldovaMongoliaMontenegroMoroccoMozambiqueMyanmarNamibiaNepalNetherlandsNew CaledoniaNew ZealandNicaraguaNigerNigeriaNorth AmericaNorwayOECD membersOmanOther small statesPacific island small statesPakistanPalauPanamaPapua New GuineaParaguayPeruPhilippinesPolandPortugalPost-demographic dividendPre-demographic dividendQatarRomaniaRussian FederationRwandaSamoaSao Tome and PrincipeSaudi ArabiaSenegalSerbiaSeychellesSierra LeoneSingaporeSint Maarten (Dutch part)Slovak RepublicSloveniaSmall statesSolomon IslandsSouth AfricaSouth AsiaSouth Asia (IDA & IBRD)South SudanSpainSri LankaSt. Kitts and NevisSt. LuciaSt. Vincent and the GrenadinesSub-Saharan Africa Sub-Saharan Africa (excluding high income)Sub-Saharan Africa (IDA & IBRD countries)SudanSurinameSwazilandSwedenSwitzerlandSyrian Arab RepublicTajikistanTanzaniaThailandTimor-LesteTogoTongaTrinidad and TobagoTunisiaTurkeyTuvaluUgandaUkraineUnited KingdomUnited StatesUpper middle incomeUruguayVanuatuVenezuela, RBVietnamWest Bank and GazaWorldYemen, Rep.ZambiaZimbabwe Timeline:
This timeline shows a graph from 1983 to 2016 of IBRD only. No data until 1982. Number of actual observations by date: 34.
Source name:
World Development Indicators
Source organization:
International Monetary Fund, Balance of Payments Statistics Yearbook and data files.
Categories, topics:
Economy & Growth
Last updated:
apr 23, 2017
Indicators value changes by year
Minimum:
17.035 bln
jan 1, 1988
Maximum:
444.205 bln
jan 1, 2015
At the date of observation
Value
Absolute change
Change from previous value
jan 1, 1983
23.425 bln
+23.425 bln
0.0%
jan 1, 1984
19.447 bln
-3.978 bln
-16.98%
jan 1, 1985
20.731 bln
+1.284 bln
6.6%
jan 1, 1986
19.417 bln
-1.314 bln
-6.34%
jan 1, 1987
17.398 bln
-2.019 bln
-10.4%
jan 1, 1988
17.035 bln
-363.084 mln
-2.09%
jan 1, 1989
17.89 bln
+854.602 mln
5.02%
jan 1, 1990
20.674 bln
+2.784 bln
15.56%
jan 1, 1991
26.979 bln
+6.305 bln
30.5%
jan 1, 1992
27.707 bln
+727.758 mln
2.7%
jan 1, 1993
30.21 bln
+2.503 bln
9.04%
jan 1, 1994
30.221 bln
+10.366 mln
0.03%
jan 1, 1995
40.171 bln
+9.951 bln
32.93%
jan 1, 1996
51.723 bln
+11.552 bln
28.76%
jan 1, 1997
56.764 bln
+5.041 bln
9.75%
jan 1, 1998
61.917 bln
+5.154 bln
9.08%
jan 1, 1999
62.917 bln
+999.891 mln
1.61%
jan 1, 2000
58.54 bln
-4.377 bln
-6.96%
jan 1, 2001
75.05 bln
+16.511 bln
28.2%
jan 1, 2002
70.567 bln
-4.483 bln
-5.97%
jan 1, 2003
59.655 bln
-10.913 bln
-15.46%
jan 1, 2004
76.684 bln
+17.029 bln
28.55%
jan 1, 2005
93.3 bln
+16.616 bln
21.67%
jan 1, 2006
137.068 bln
+43.768 bln
46.91%
jan 1, 2007
198.248 bln
+61.179 bln
44.63%
jan 1, 2008
289.687 bln
+91.439 bln
46.12%
jan 1, 2009
341.476 bln
+51.789 bln
17.88%
jan 1, 2010
269.43 bln
-72.045 bln
-21.1%
jan 1, 2011
321.975 bln
+52.545 bln
19.5%
jan 1, 2012
340.862 bln
+18.886 bln
5.87%
jan 1, 2013
363.068 bln
+22.206 bln
6.51%
jan 1, 2014
382.879 bln
+19.811 bln
5.46%
jan 1, 2015
444.205 bln
+61.327 bln
16.02%
jan 1, 2016
404.494 bln
-39.711 bln
-8.94%
Ranking of countries by current statistics by years


Comments: